The AG is built (Part 5). Now we verify it actually works: replication is happening, the secondary is receiving log records, reads work on the secondary (Enterprise readable secondary feature), writes fail on the secondary (read-only enforcement), and the dashboard reports both replicas Synchronized.
This part is mostly read-only verification — we’re proving the AG is healthy before exercising failover in Part 7. Skip this and any failover problems you hit later will be impossible to diagnose because you don’t know whether the AG was healthy to begin with.
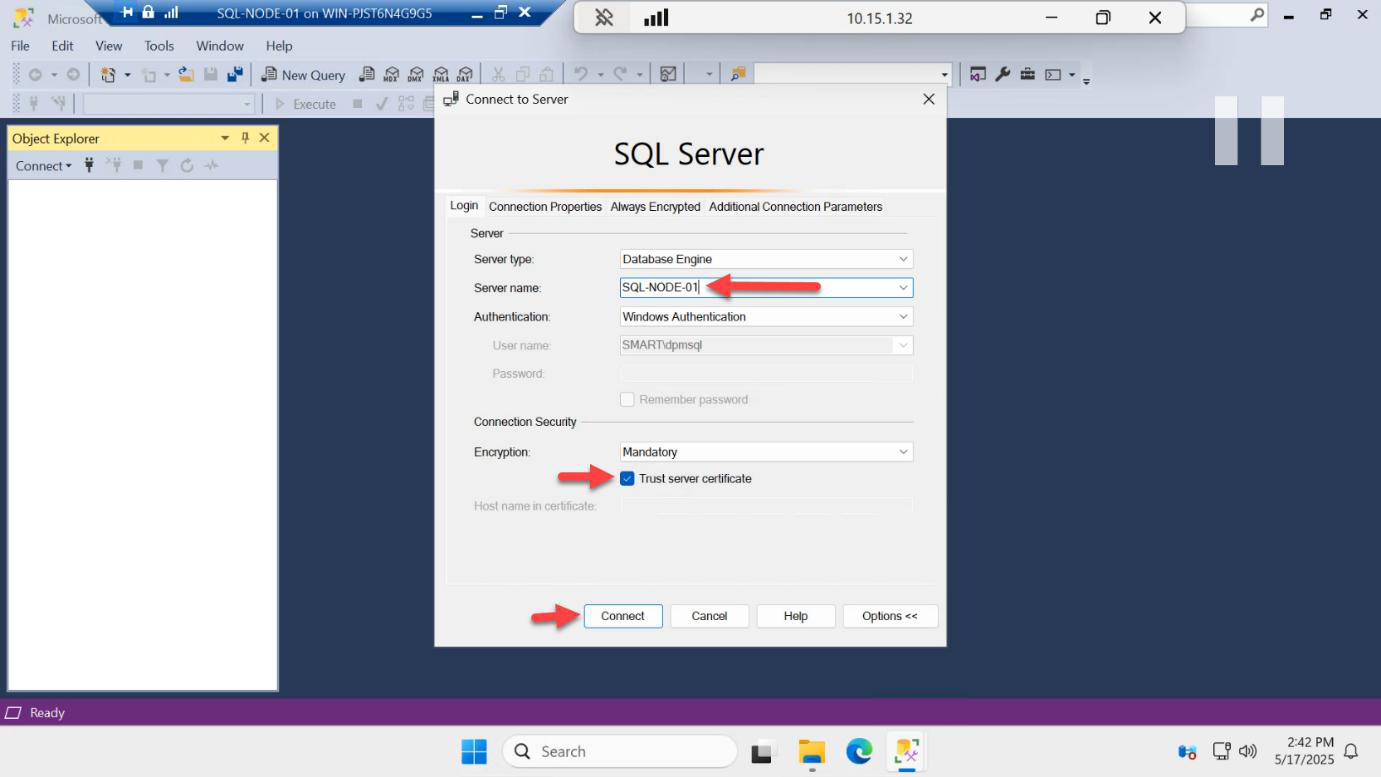
Re-open SSMS — the listener may route you to the secondary

Close any SSMS sessions on SQL-NODE-01 and reopen. The act of closing/reopening flushes connection state so we get a fresh view of the AG.
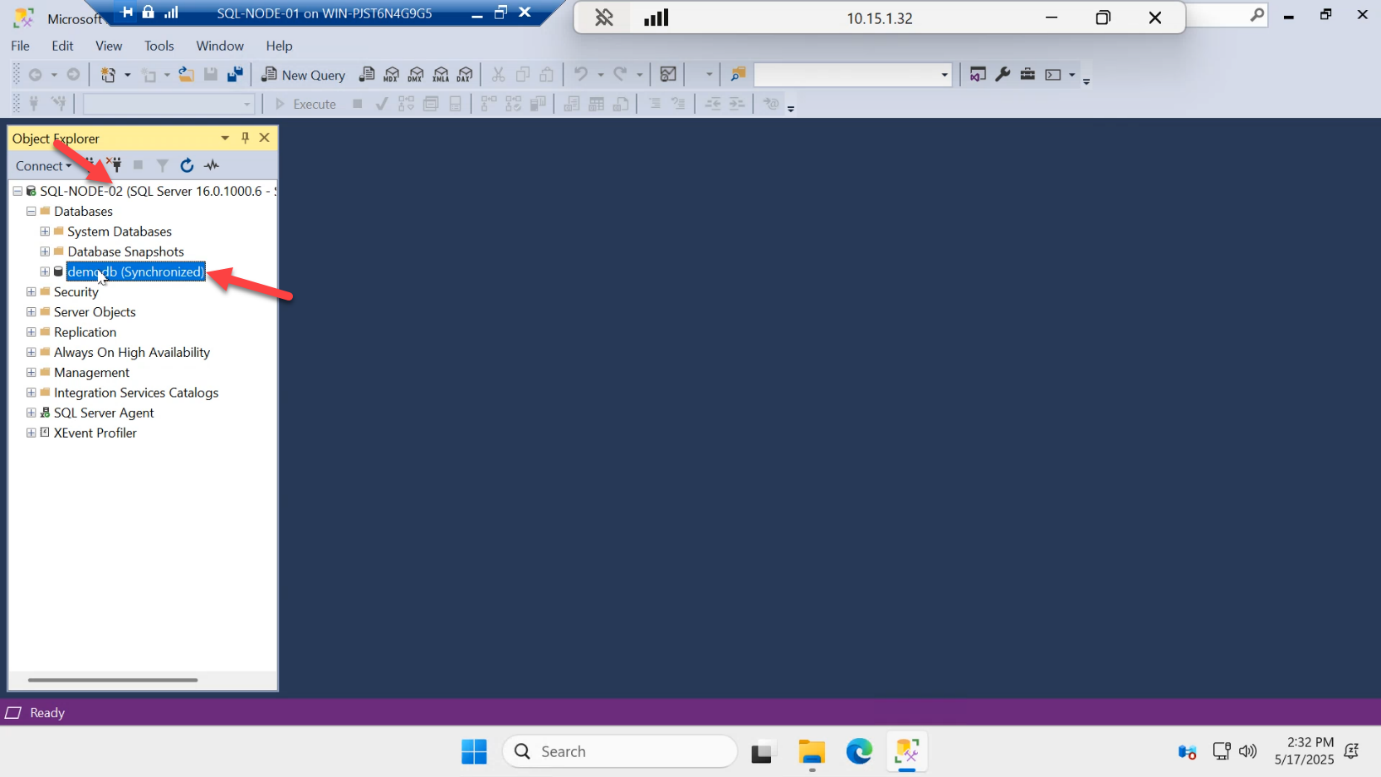
Notice something: depending on whether you connected to the listener (AG-LISTENER) or the node directly, you may land on SQL-NODE-02 from SQL-NODE-01. The listener with ApplicationIntent=ReadOnly would route you to the secondary — useful for read-heavy reporting workloads. Either way, you can see demodb and its status: Synchronized.
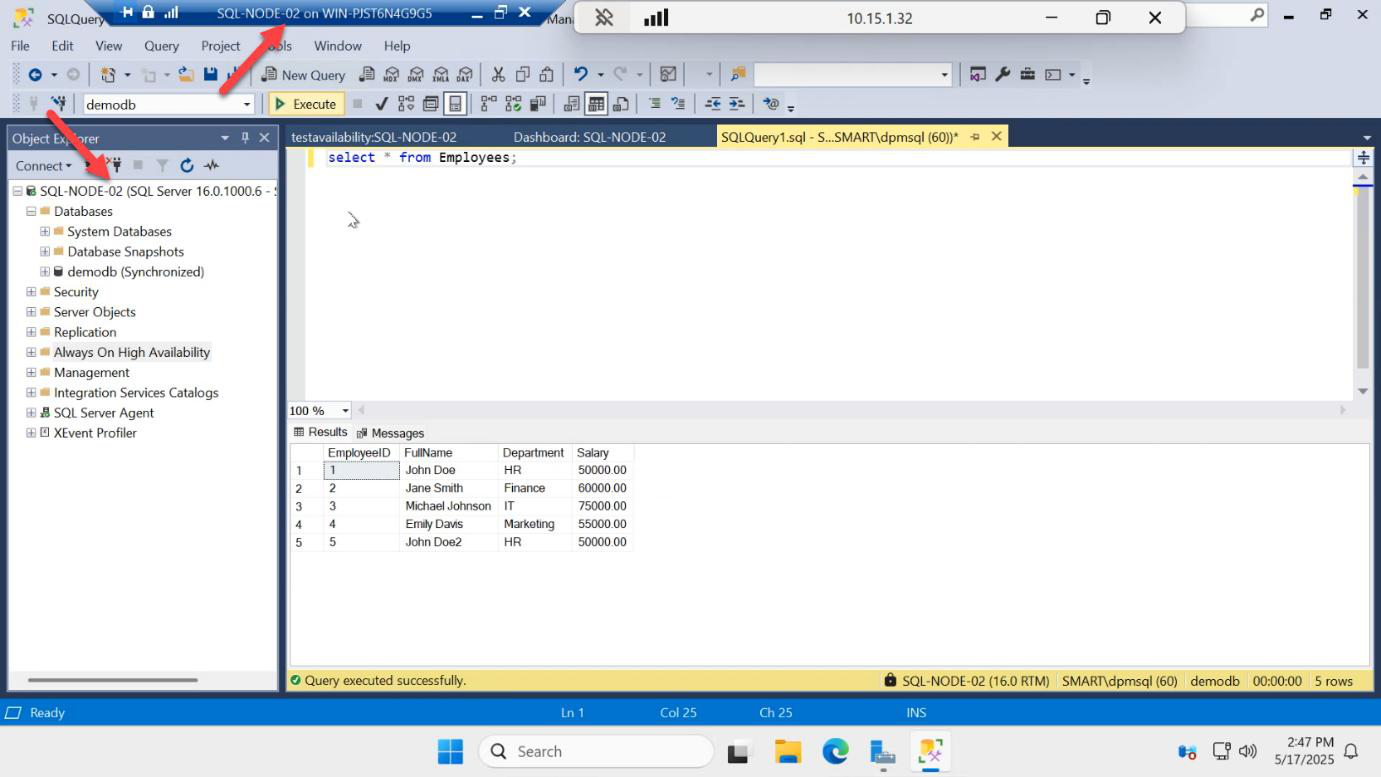
Read from the secondary
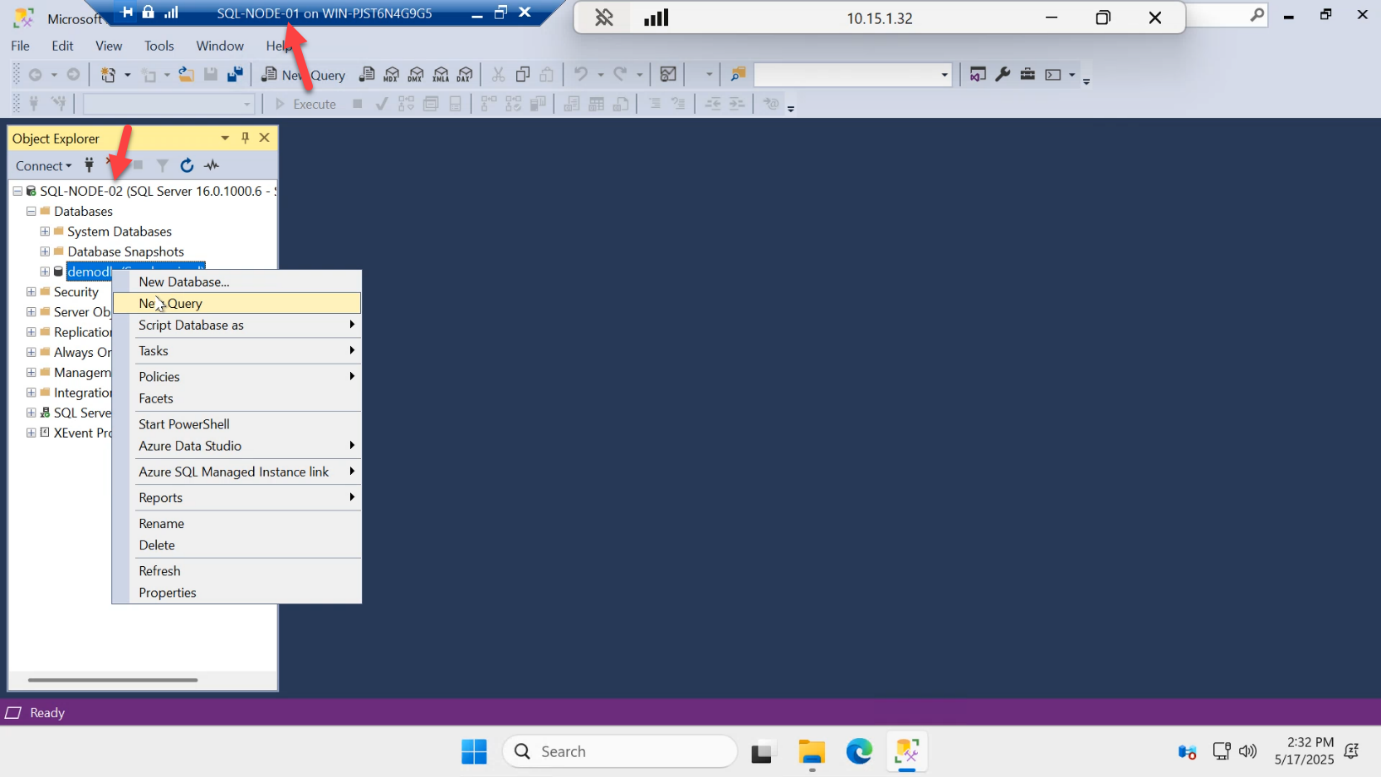
demodb on the SQL-NODE-02 secondary > New Query.Right-click demodb on SQL-NODE-02 > New Query.
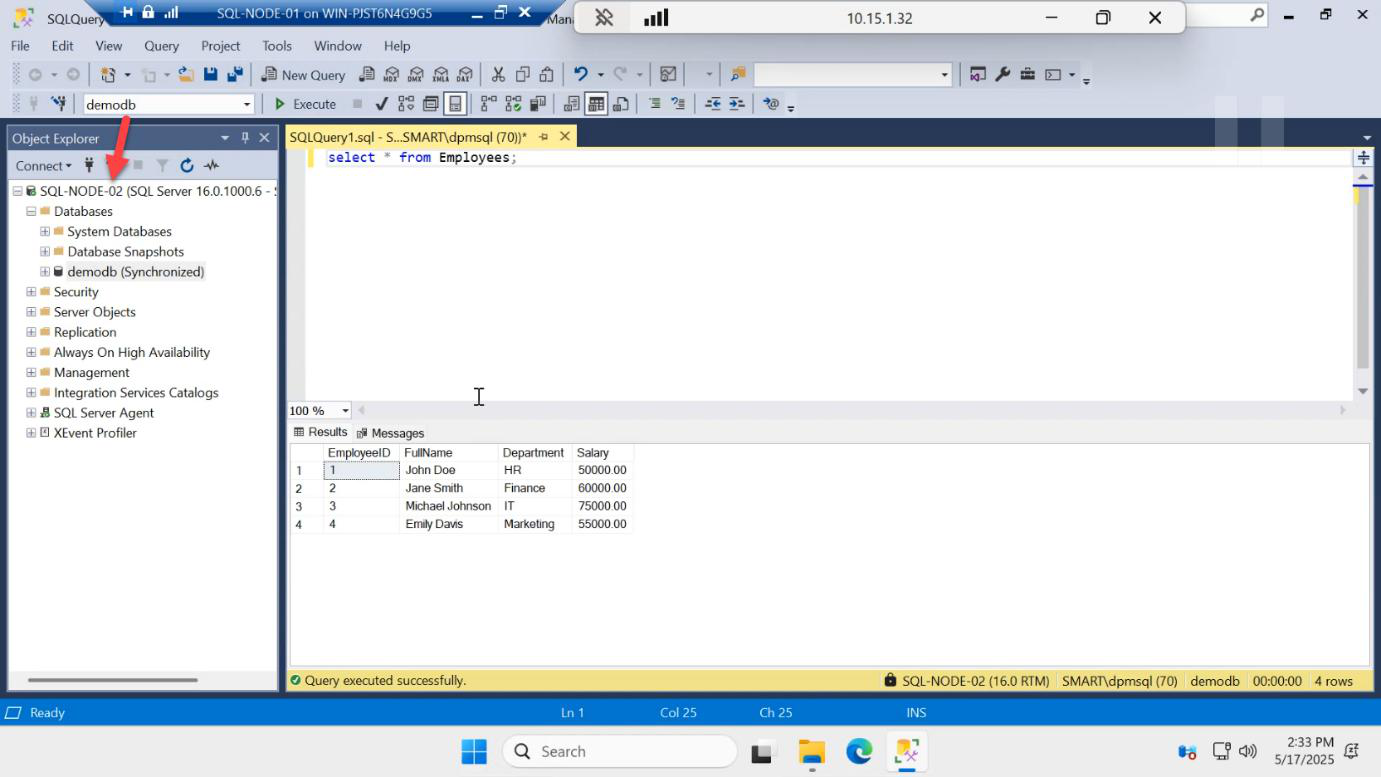
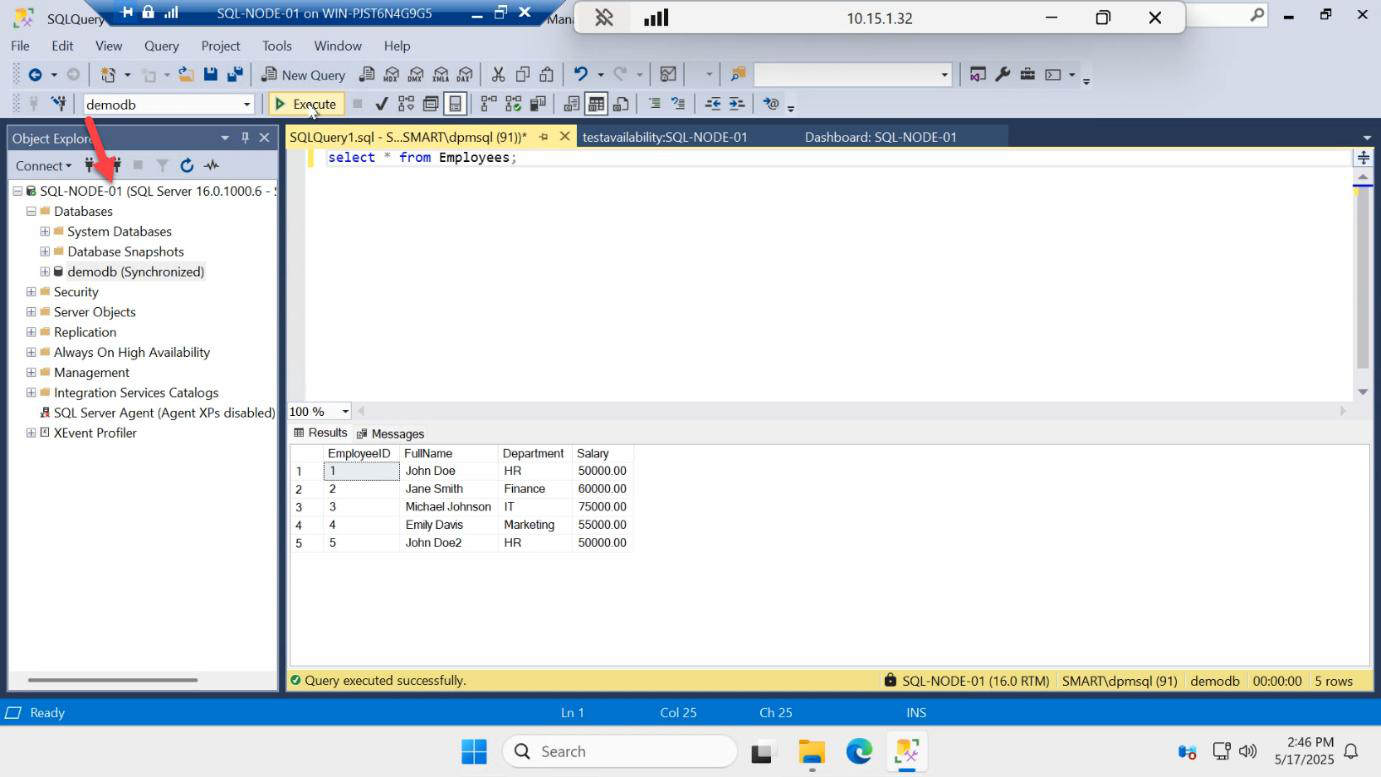
SELECT * FROM dbo.Employees; — reads succeed. Readable secondary works (Enterprise/Evaluation feature). On Standard edition this would error out.Run:
SELECT * FROM dbo.Employees;You get all 3 rows back. This proves readable secondary works.
Why this matters: in classic SQL HA (mirroring, log shipping), the standby database was inaccessible until you failed over to it. Always On Availability Groups can serve reads off the secondary while it’s still synchronizing, so reporting queries don’t hammer the primary. Caveat: this requires Enterprise edition (or Evaluation, which is what we’re using). On Standard edition the secondary is unreadable — trying the same SELECT throws an error.
Try to write to the secondary — should fail
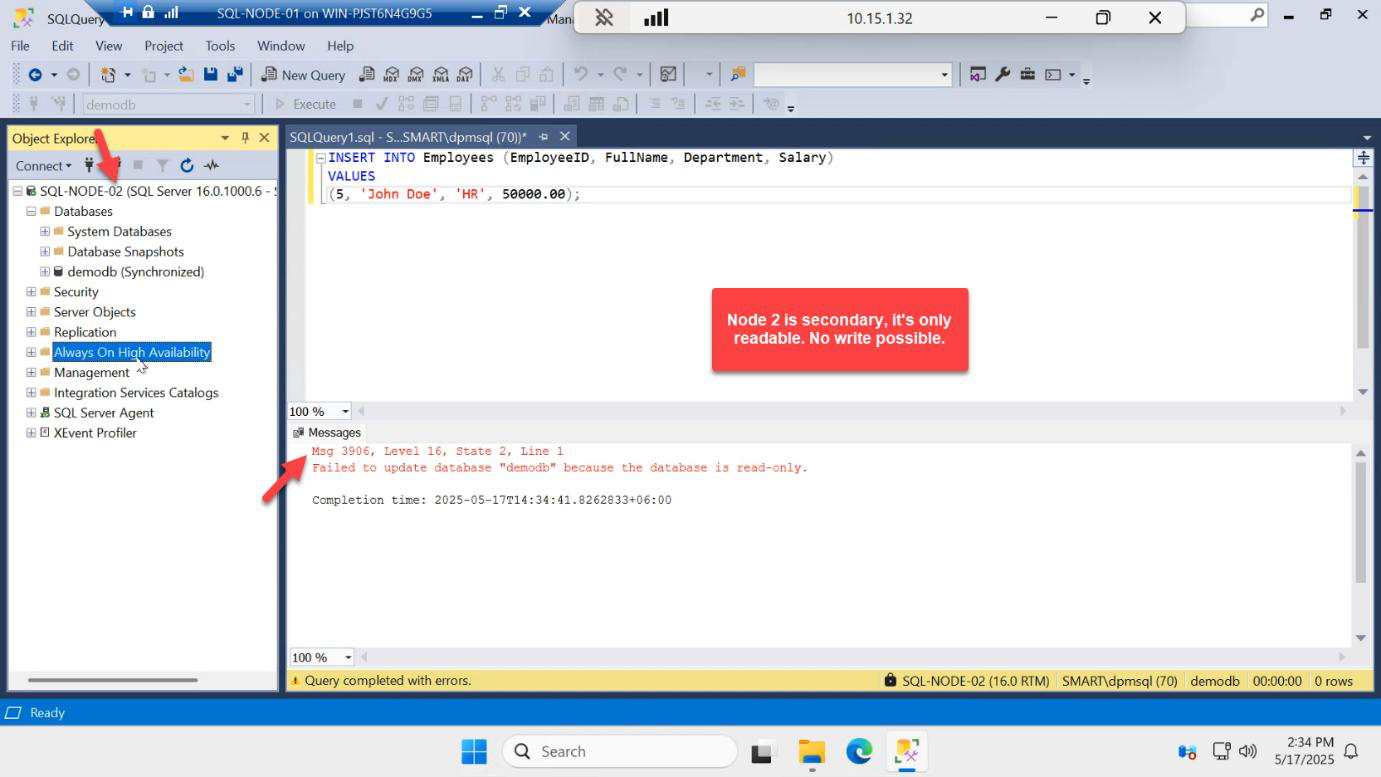
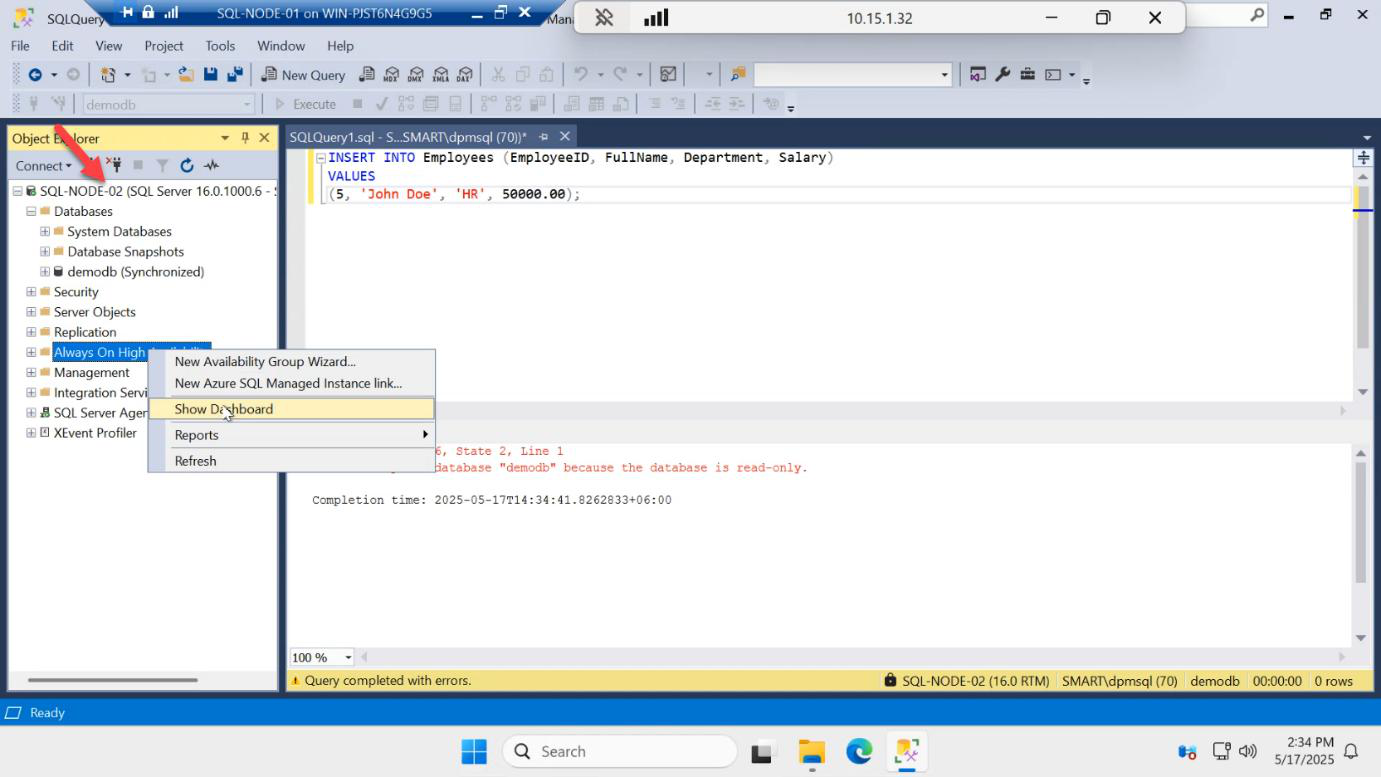
INSERT INTO dbo.Employees VALUES (4, 'Dave', 'NetEng'); — Msg 3906: Failed to update database “demodb” because the database is read-only. Secondary is read-only by design.In the same query window:
INSERT INTO dbo.Employees VALUES (99, 'Eve', 'Test');Result: Msg 3906, Level 16, State 1 — Failed to update database “demodb” because the database is read-only.
This is correct AG behaviour. Secondary replicas accept reads only. All writes go to the primary, which then ships log records to the secondary. If you could write to both, you’d have split-brain in seconds.
Apps that need to write must connect to the listener with no ApplicationIntent (or ReadWrite) and they’ll always be routed to the current primary.
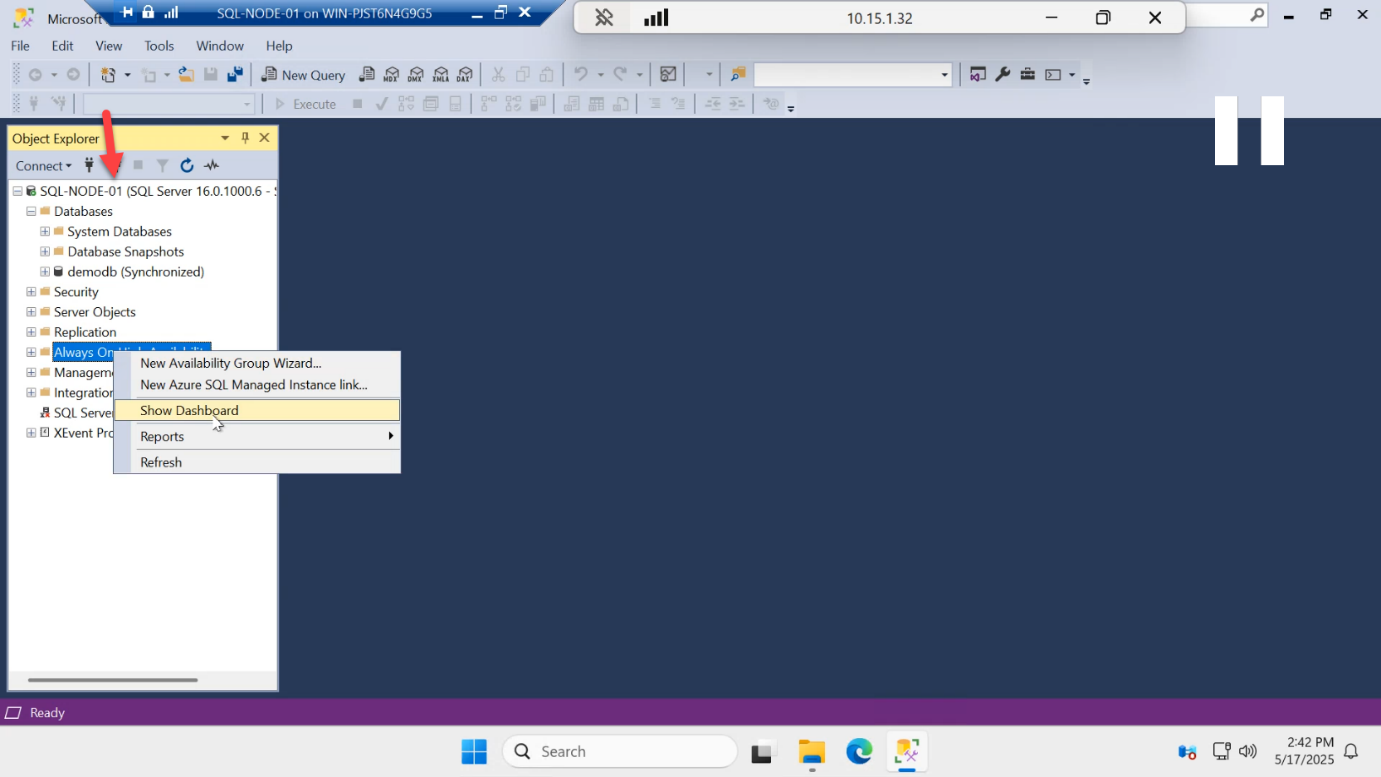
Open the AG dashboard
Right-click AG-DEMO in Object Explorer > Show Dashboard.
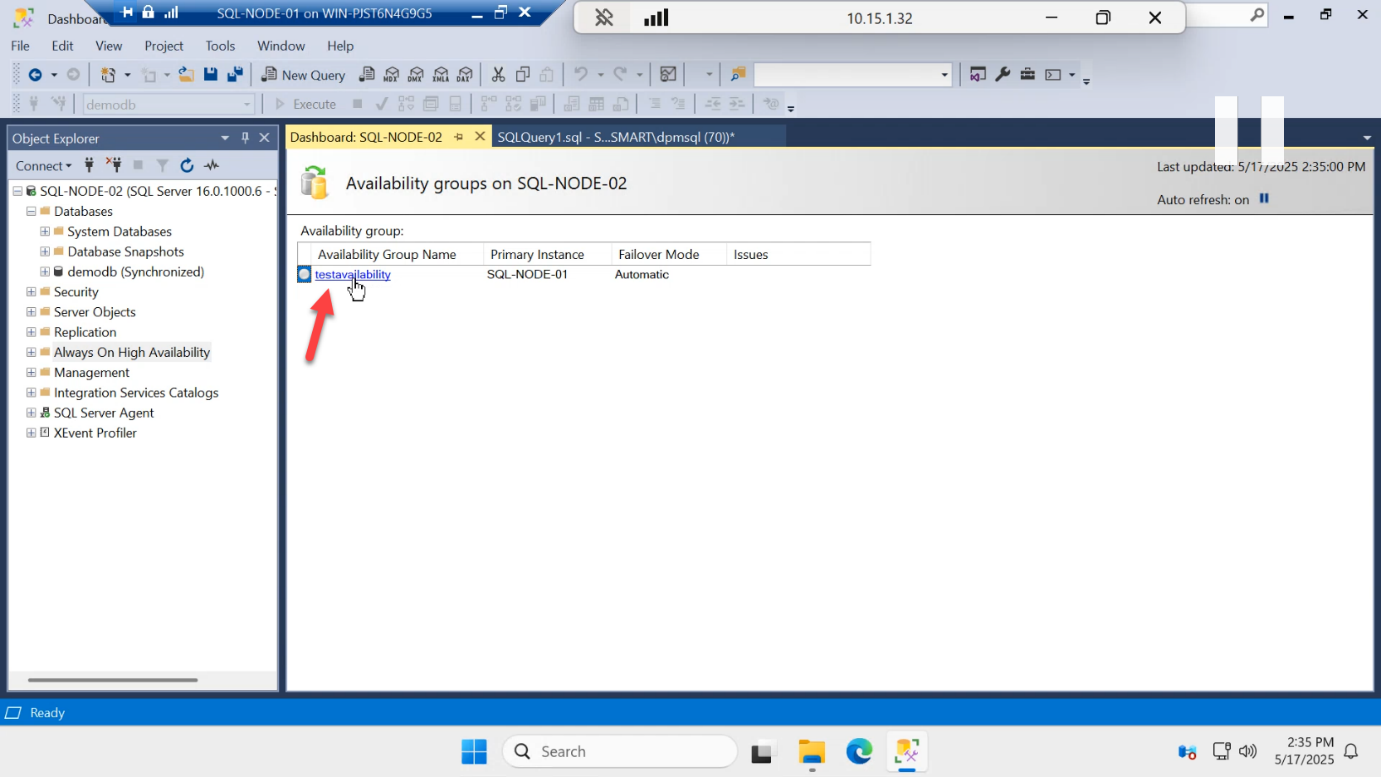
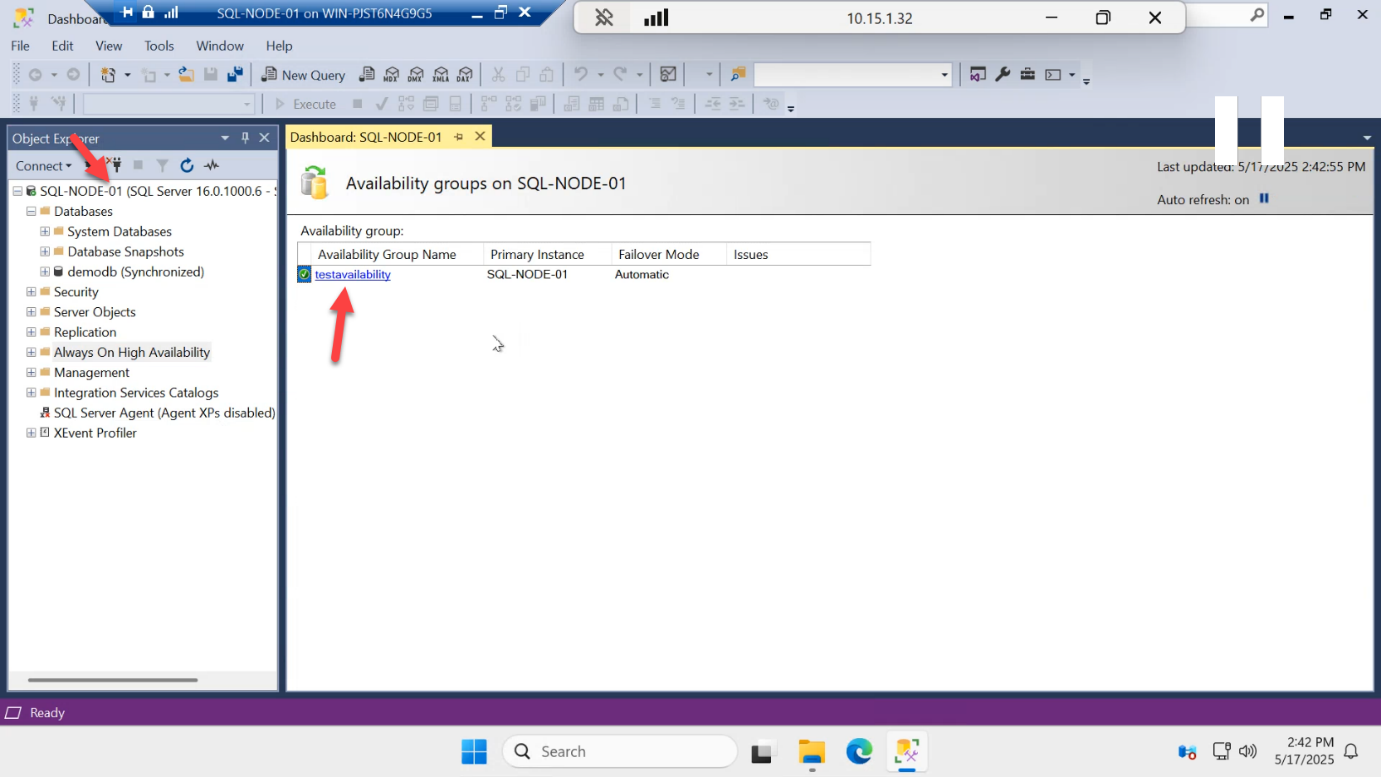
Click the AG name to drill into per-replica health.
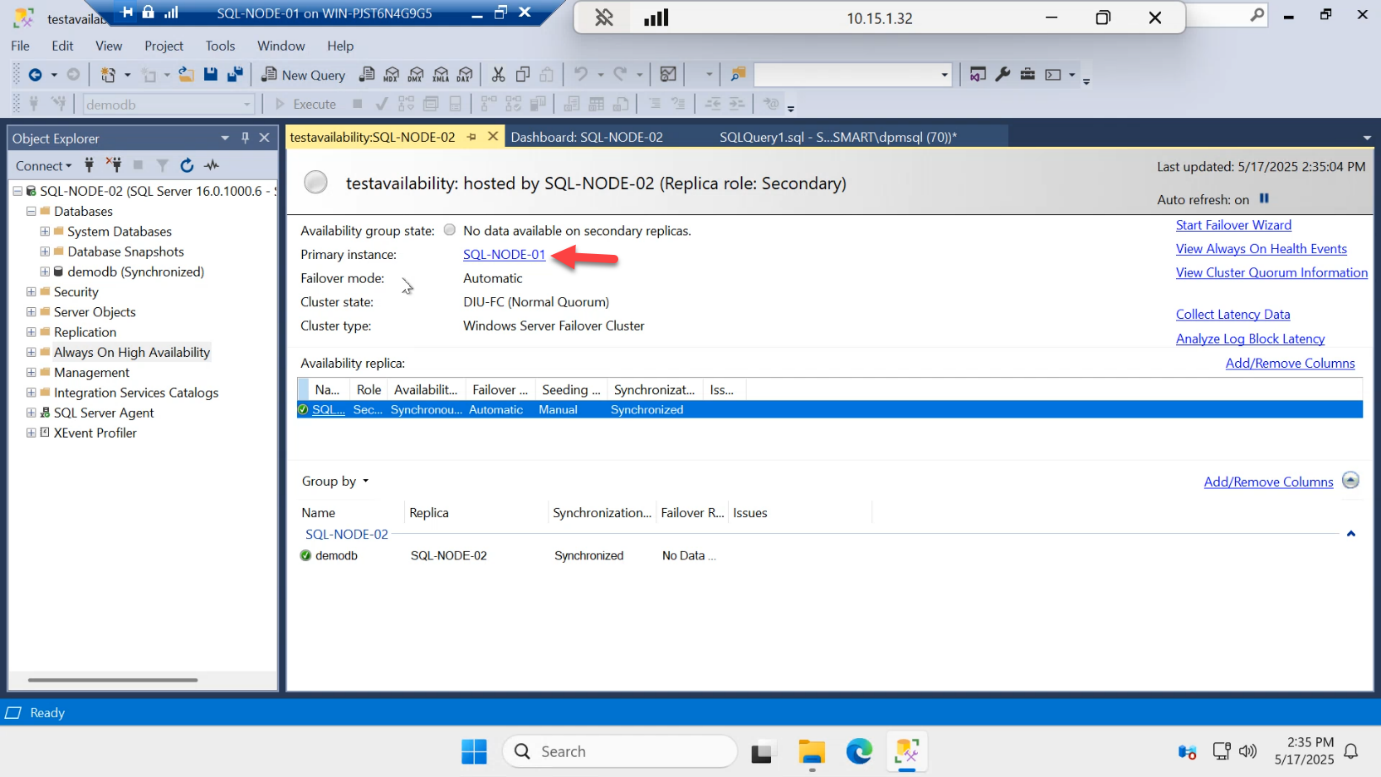
Detail view confirms:
- Primary instance: SQL-NODE-01
- AG state: Healthy
- Both replicas: Synchronized
- Estimated data loss: 0 sec
- Estimated recovery time: 0 sec
If anything is yellow or red here, do NOT proceed to Part 7. Investigate first — common issues:
- Not Synchronizing — endpoint port 5022 blocked by firewall
- Not Synchronized — secondary still catching up after initial seed; wait, then refresh
- Disconnected — one node is down, network partition, or service stopped
Connect directly to the primary
Close SSMS again, reopen.
SQL-NODE-01 as the server name (not the listener) so we connect directly to the primary.Connect explicitly to SQL-NODE-01 (not the listener). This bypasses any read-routing and lands you on the primary directly.
Open the AG dashboard from the local primary’s view.
Click AG-DEMO in the dashboard.
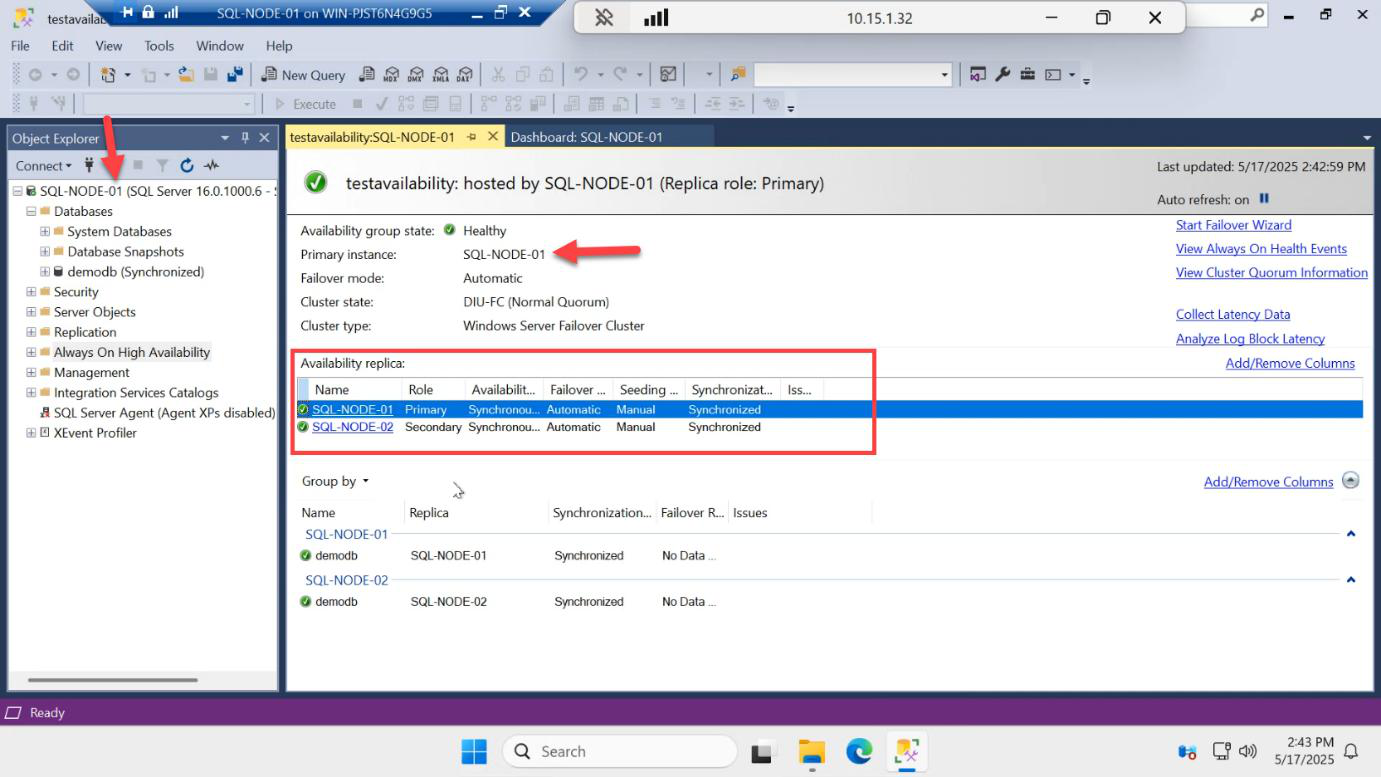
Same data, different vantage point: SQL-NODE-01 = Primary, SQL-NODE-02 = Secondary, both Synchronized. The AG looks the same from either node — that’s a sign of healthy cluster + endpoint communication.
Write on the primary, watch it land on the secondary
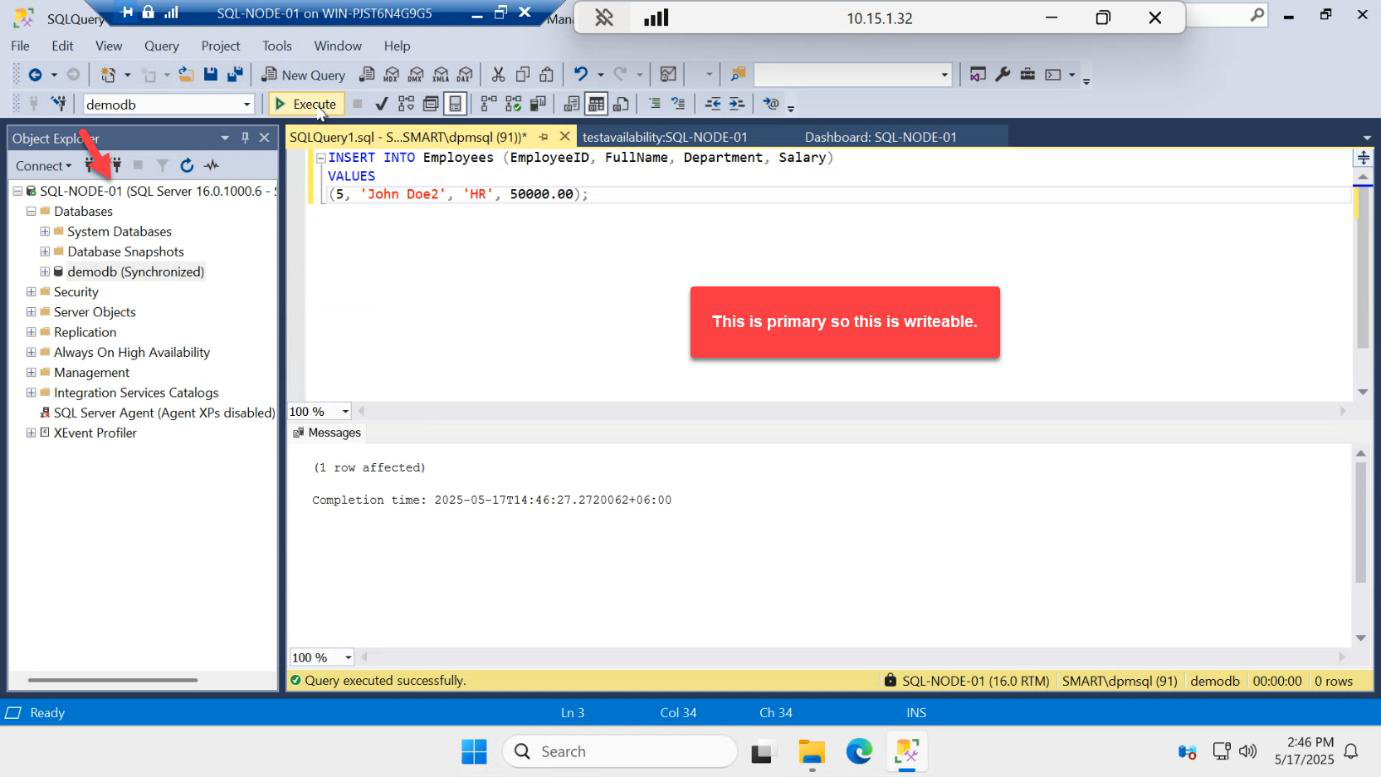
INSERT INTO dbo.Employees VALUES (4, 'Dave', 'NetEng');On the primary (SQL-NODE-01):
USE demodb;
INSERT INTO dbo.Employees VALUES (4, 'Dave', 'NetEng');
Succeeds. The transaction commits locally and SQL ships the log record to the secondary endpoint immediately.
SELECT on the primary — new row visible.
Switch to SQL-NODE-02, open SSMS, connect to the local instance, run the same SELECT against demodb. Dave is there. Replication confirmed end-to-end.
The lag between primary commit and secondary visibility, in synchronous commit mode on a same-LAN setup, is sub-millisecond. You won’t see latency unless you’re running heavy transactional workloads.
Things that bite people
Synchronization state stays Synchronizing forever
The secondary is receiving log records but can’t catch up. Usually because the network endpoint is choked, the secondary disk is slow, or there’s a long-running transaction on the primary that’s holding log truncation. Look at sys.dm_hadr_database_replica_states for redo queue size.
Secondary shows Disconnected
Endpoint comms failed. Check Windows Firewall on both nodes (port 5022), check the SQL service account on each side has the same identity, check there are no certificate mismatches if you’ve customized endpoint security.
Standard edition + tried readable secondary
Standard limits you to 2 replicas, no readable secondary, no read-only routing. The query against the secondary database returns “The target database is participating in an availability group and is currently not accessible for queries.” Upgrade to Enterprise/Evaluation, or accept that the secondary is just standby.
App still writing to the wrong node after failover
App is connecting to SQL-NODE-01 directly instead of AG-LISTENER. Always use the listener in connection strings — that’s the whole point of having a listener.
Replication looks broken because you queried the system database
Always On replicates user databases only. master, msdb, tempdb, model are NOT replicated. Logins, jobs, linked servers, etc. configured on the primary do NOT auto-propagate to the secondary — you maintain those separately.
What’s next
Part 7 in the SQL Availability Groups pathway: manual failover testing. Use the Start Failover Wizard to swap primary from SQL-NODE-01 to SQL-NODE-02 and back, then test automatic failover by restarting and shutting down the primary VM — watching the cluster automatically promote the surviving secondary.