repadmin /replsummary is the single most useful command for telling you whether AD replication is healthy. One terminal, one keystroke, two columns of numbers that immediately surface every DC that’s falling behind or failing. This is Part 10 — the last post — of the AD Replication Deep Dive series, and it’s about turning everything in Parts 1–9 into something you can monitor on a daily cadence.
What the command does
Run repadmin /replsummary from any DC in the forest. It contacts every DC it can find (via the Configuration NC’s site/server objects) and asks each: “What’s the worst replication relationship you have right now?”
Output is two tables — one keyed by Source DSA (every DC seen as a sender), one keyed by Destination DSA (every DC seen as a receiver). Each table has the same columns:
repadmin /replsummary output. Source DSA = sender, destination DSA = receiver, largest delta = longest time since a successful sync, fails/total = error count vs attempts, %% = failure percentage, error = code/message if anything failed.Column-by-column
Source DSA / Destination DSA
“DSA” (Directory System Agent) is the formal name for a domain controller. Source means “this DC is sending data to others.” Destination means “this DC is receiving data from others.”
The two tables are symmetric — a problem will usually show up in both. But sometimes one direction works and the other doesn’t (asymmetric firewall rules, RODC pull-only setup), so checking both halves matters.
largest delta
The longest time since any of this DC’s replication partners last received a successful update from / sent a successful update to this DC. Format is HH:MM:SS or Xd Yh Zm for longer outages.
Thresholds you should care about:
| Delta | Meaning |
|---|---|
| < 30 min | Healthy. Normal jitter, expected. |
| 30 min – 3 h | Acceptable for inter-site, suspicious for intra-site. Check site links if intra-site. |
| 3 h – 24 h | Something is off. The longest legal inter-site cycle is rare in modern setups. |
| 1 d – 7 d | Active problem. WAN, DNS, or Kerberos issue. Investigate now. |
| > 7 d | Replication is broken. If the DC has been offline approaching the tombstone lifetime, you’re at risk of lingering objects. |
fails / total
Counters of failed and total replication attempts since the last reset. 0 / 12 means 12 attempts, all succeeded. 3 / 12 means 3 of the last 12 failed. 5 / 5 means every attempt failed.
Reading fails / total:
- 0 fails — healthy.
- Some fails, recent total still growing — intermittent issue (flaky WAN, transient DNS). Watch and re-run.
- fails == total — this DC isn’t replicating at all with the partner in question. Hard failure.
%% (failure percentage)
Calculated: fails ÷ total × 100. The repadmin tool displays as raw percent. Treat > 10% sustained as “needs investigation,” > 50% as “emergency.”
error
If the most recent attempt failed, the AD error code and short message appear here. Common codes:
| Code | Common cause |
|---|---|
8606 |
Insufficient attributes provided. Often DNS resolution failure of the partner. |
1722 (RPC server unavailable) |
Network / firewall / DC is offline. Check basic connectivity. |
1908 |
Could not find DC for this domain. DNS misconfiguration on the requesting DC. |
8453 |
Replication access was denied. Trust or Kerberos issue. |
1256 |
The remote system is not available. Often a name-resolution dead end. |
1988 |
Strict replication consistency: lingering object detected (Event 1988, Part 9). |
| blank | Last attempt succeeded. Everything is fine for this row. |
Reading a healthy report
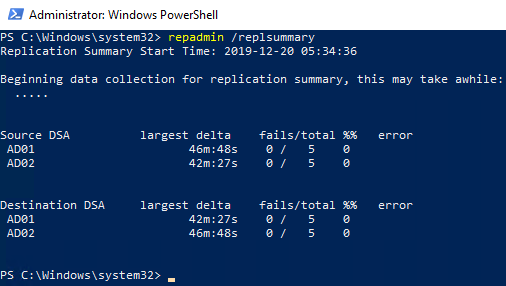
A typical 2-DC lab:
Source DSA          largest delta    fails/total %%   error
 AD01                 46m:48s          0 /   5    0
 AD02                 42m:27s          0 /   5    0

Destination DSA     largest delta    fails/total %%   error
 AD01                 46m:48s          0 /   5    0
 AD02                 42m:27s          0 /   5    0
What this says: AD01 and AD02 last successfully exchanged updates roughly 45 minutes ago. Five replication attempts each, zero failures. No errors. This is what healthy looks like. The 45-min delta is fine because intra-site notification fires only when changes exist — no changes recently = no syncs — or this lab uses inter-site polling.
Reading a broken report
Source DSA          largest delta    fails/total  %%   error
 AD01                 12m:14s          0 /   8     0
 AD02                 12m:14s          0 /   8     0
 AD03                 3h:08m           1 /   5    20   8606 (insuff attribs)

Destination DSA     largest delta    fails/total  %%   error
 AD01                 12m:14s          0 /   8     0
 AD02                 12m:14s          0 /   8     0
 AD03                 3h:08m           1 /   5    20   8606
AD01 and AD02 are healthy. AD03 had one failure in its last five attempts, and the longest gap since a successful exchange is 3 hours 8 minutes. Error 8606 — almost always DNS. Check whether AD01 / AD02 can resolve AD03’s SRV records and vice versa.
Drilling deeper when replsummary flags something
replsummary tells you where the problem is. You need other repadmin verbs to find what:
repadmin /showrepl AD03Per-NC, per-partner detail for one DC. Shows the last-success timestamp and last-failure error code for every (NC, partner) pair.
repadmin /showutdvec AD03 "DC=contoso,DC=com"The UTDV (up-to-dateness vector) on AD03 for the Domain NC. Shows whether AD03’s view of the forest is current.
repadmin /queue AD03Pending replication tasks waiting to be processed on AD03. A growing queue means the DC can’t keep up.
dcdiag /test:replications /vBroader health test that includes replication along with DNS, services, FSMO accessibility. Use when replsummary shows trouble but you don’t yet have a hypothesis.
Making this a daily check
Combine into a scheduled health script that emails when delta crosses a threshold:
$summary = repadmin /replsummary /bysrc /bydest
$bad = $summary -match '(\d+h:\d+m|\d+d)|fail'
if ($bad) {
    Send-MailMessage -To "ad-team@contoso.com" `
        -From "ad-monitor@contoso.com" `
        -Subject "AD replication needs attention" `
        -Body ($summary -join "`n") `
        -SmtpServer "smtp.contoso.com"
}
Run every 30 minutes from a management server. Catches issues hours before users notice.
The full daily playbook
- Run
repadmin /replsummary. Healthy? Done. - Found a high delta or failures? Identify which DCs are involved.
- On the destination DC, run
repadmin /showrepl. Look at the partner row that’s failing. - Read the error code. Match it to the common-cause table above.
- For DNS errors:
nslookup -type=SRV _ldap._tcp.dc._msdcs.<domain>from the failing DC. - For RPC errors:
Test-NetConnection <partner> -Port 135; check firewall rules. - For Kerberos / access denied:
w32tm /monitorto check time skew; verify trust health. - For lingering-object errors: jump to Part 9’s cleanup procedure.
- After fixing, force a sync:
repadmin /syncall /Ae /P. - Re-run
repadmin /replsummaryto confirm the fails counter stops climbing.
Things that bite people
repadmin runs from anywhere but the output reflects who you ask
repadmin /replsummary with no DC name targets the local machine’s site. Pass /bysrc /bydest or specify a server (repadmin /replsummary DC01) for explicit results. Otherwise a network glitch on the box you’re running from looks like a forest-wide problem.
The counters reset on service restart
Restarting Active Directory Domain Services on a DC zeros the fails/total. If you see 0 / 0 on a DC you know had problems yesterday, the service was restarted — the report is honest about “no recent attempts” but doesn’t tell you the history.
A clean replsummary doesn’t mean clean replication
The report shows replication-protocol health, not directory content health. A forest can have lingering objects, orphaned SYSVOL, or out-of-sync FSMO holders with a clean replsummary. Pair this command with dcdiag and periodic checks of CN=LostAndFound for full coverage.
Stale DC entries skew the report
If you decommissioned a DC without cleaning metadata, it still appears in replsummary as a 999-day-delta entry. This isn’t a real failure to fix — it’s a stale Configuration NC entry. ntdsutil metadata cleanup on a healthy DC removes it.
Inter-site DCs always show some delta
An inter-site partner with a 180-minute schedule will normally show a delta of up to 3 hours even when perfectly healthy. Don’t alert at 1-hour thresholds for inter-site relationships — tune to your schedule.
End of series
That’s the AD Replication Deep Dive. Ten parts, from the bottom layer (USNs) to the top layer (the dashboard).
You now have:
- The vocabulary — USN, originating vs replicated write, DSA GUID, invocation ID, HWMV, UTDV.
- The two replication models — multi-master and single-master / FSMO.
- How an object’s per-attribute metadata changes during replication.
- The five-step cycle that moves one NC between two DCs.
- The two clocks — intra-site (15 sec) and inter-site (15 min minimum).
- How the KCC builds the topology and the ISTG handles inter-site.
- What bridgeheads are, how they’re picked, and when to override.
- The version → timestamp → GUID conflict resolution chain.
- How tombstones and the tombstone lifetime create the lingering-object failure mode.
- Today’s post —
repadmin /replsummaryfor daily monitoring.
Bookmark the pathway page and come back to specific parts when something breaks. The next pathway in the InfoTech Ninja systems-admin track digs into the layer below AD: DNS — the service everything in this series quietly depended on.