Most live PerfMon use is interactive — open the console, drop a few counters in, watch the graph, close. The interactive view answers “what is happening right now,” but doesn’t answer “what was happening at 02:30 last Tuesday when the application was slow.” For that, you need a scheduled capture: a Data Collector Set that opens at a chosen time, records the counters you care about into a binary log file (.blg), stops on its own after a configured duration, and leaves the file on disk for offline analysis whenever you get to it. This post walks the lab’s 22:30-to-23:00 nightly capture of CPU + Memory utilisation, the schedule + permissions configuration that makes it fire unattended, and the analysis options once the BLG lands.
What you need before starting
- Windows Server (or any Windows release with the Performance Monitor console — even Windows 11 Pro)
- Local administrator rights on the target machine
- An admin-or-service account to run the scheduled capture as (the schedule has to run as someone)
- An idea of which counters and what time window you actually need — the more specific the question, the smaller the BLG and the easier the analysis
The shape of a Data Collector Set
A Data Collector Set (DCS) is a saved bundle of:
- Counters to capture — one or more performance counters from the same provider universe you’d use for live PerfMon. Plus optionally event-trace providers and config snapshots, but for typical CPU/memory work just counters.
- Sample interval — how often the counters are read (default 15 seconds). Tune down to 1 second for high-resolution incident captures; tune up to 60 seconds for long-running baseline collections.
- Destination — where the BLG file lands. Default
%SystemDrive%\PerfLogs\<set-name>\; override per set. - Schedule — when the capture starts and on which days.
- Stop condition — when the capture stops (after N minutes, or when the BLG hits N MB, etc.).
- Security context — which account the scheduler runs as.
Save the DCS once, schedule it, and the scheduler engine handles the rest.
Step 1 — Open Performance Monitor
Run dialog (Win+R) → type perfmon → Enter. The Performance Monitor MMC opens.
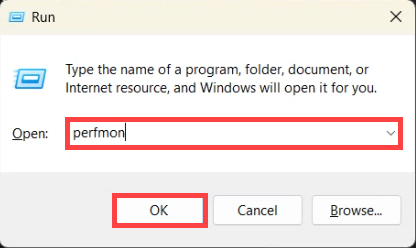
perfmon from Run launches the Performance Monitor MMC. Same console hosts the live counters and the Data Collector Set scheduling we’re about to use.Expand Data Collector Sets → User Defined in the left pane. System sub-tree above it holds the built-in collector sets (Active Directory Diagnostics, System Diagnostics, etc.); ignore those for now.
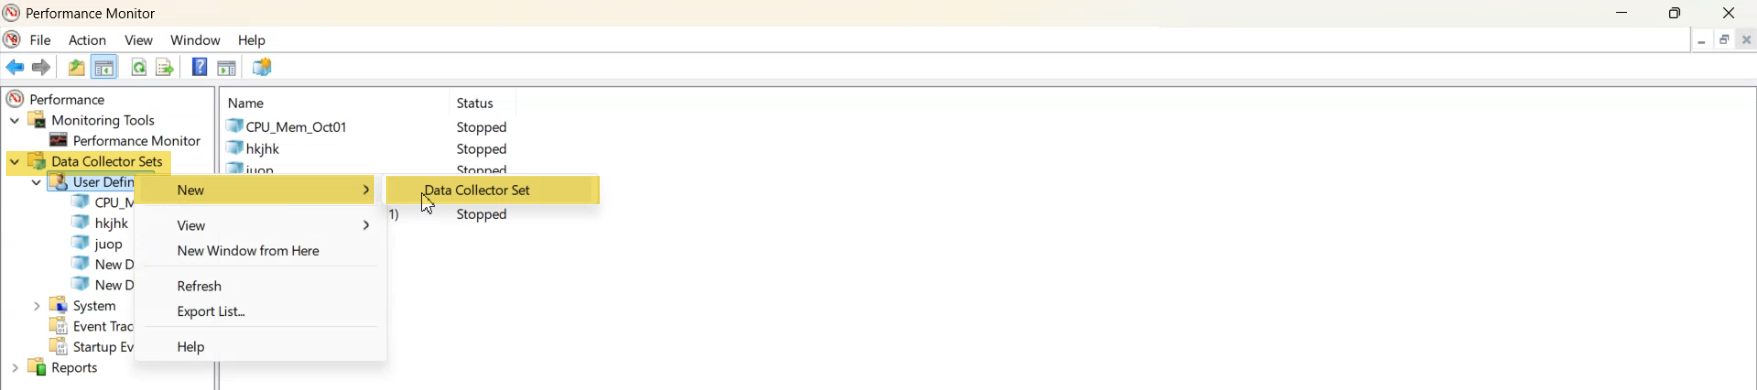
Step 2 — Create the Data Collector Set
- Right-click User Defined → New → Data Collector Set. The wizard opens.
- Name the set something searchable. The lab uses
CPU_Memory_1030_to_11PM— the embedded time window makes it easy to find the right BLG later when there are dozens of saved sets. - Pick Create manually (Advanced). The other option (Create from a template) is useful if you have an existing DCS export to clone; for one-off captures, manual is simpler.
- Click Next.
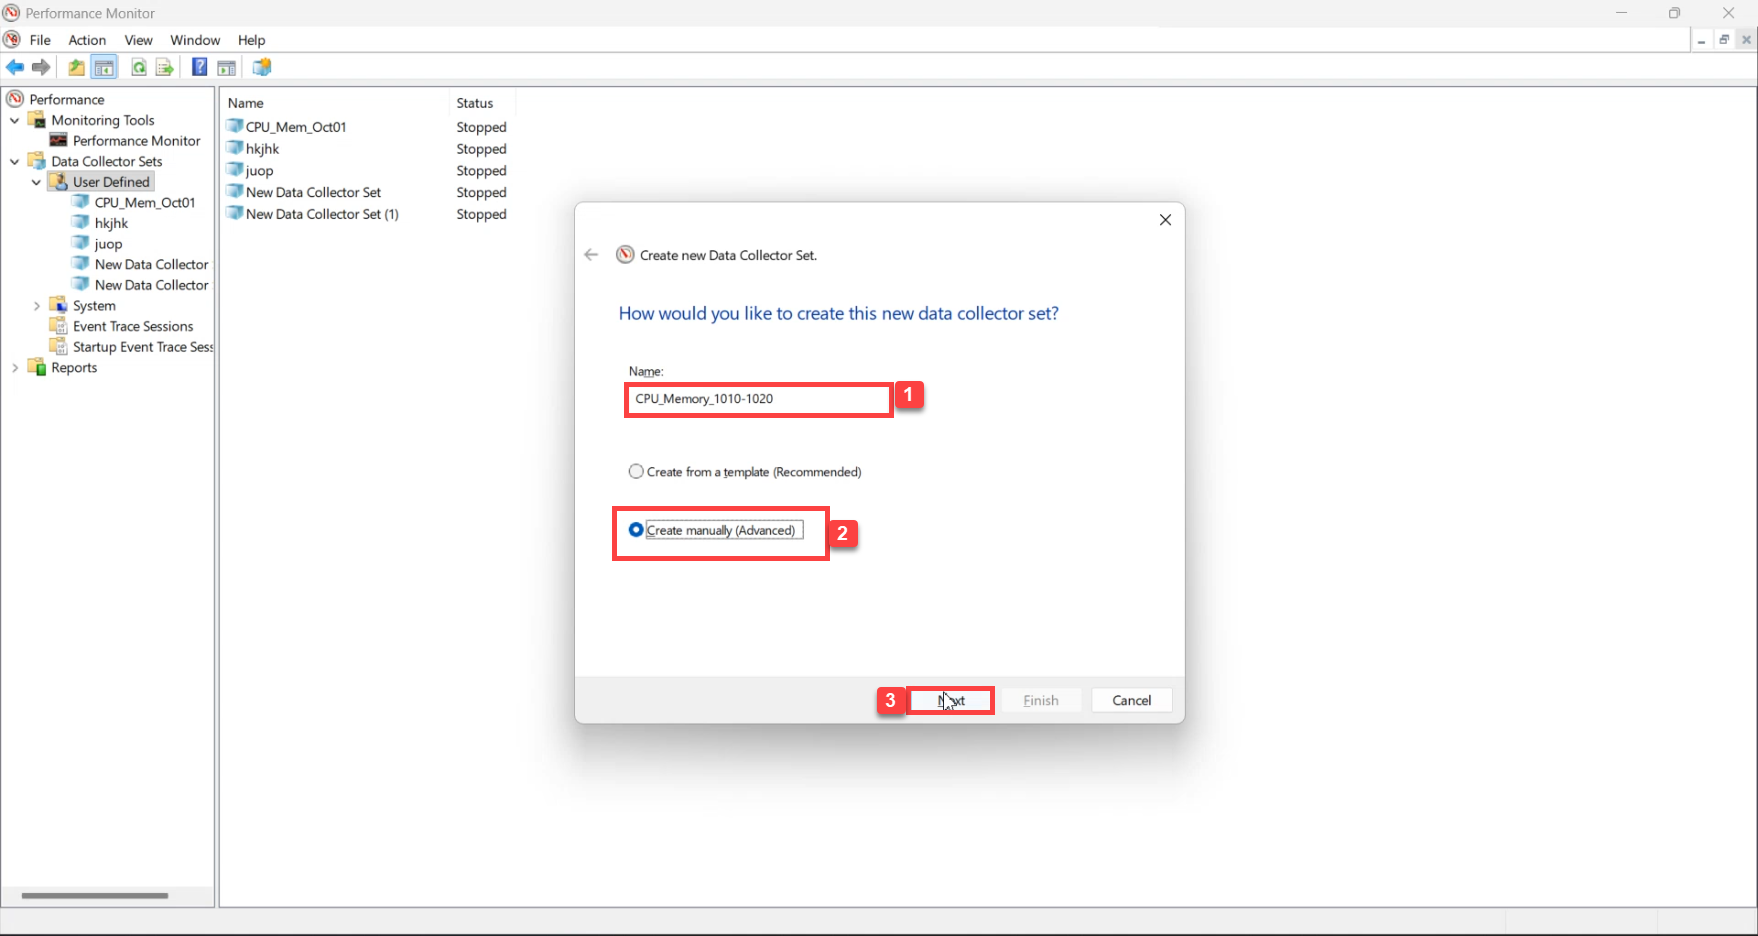
CPU_Memory_1030_to_11PM is the lab’s convention — embed the capture window in the name so you can find the right BLG later. Create manually (Advanced) exposes the counter-picker.Step 3 — Pick the counters
- On the “What type of data do you want to include?” page, tick Performance counter. Skip the others.
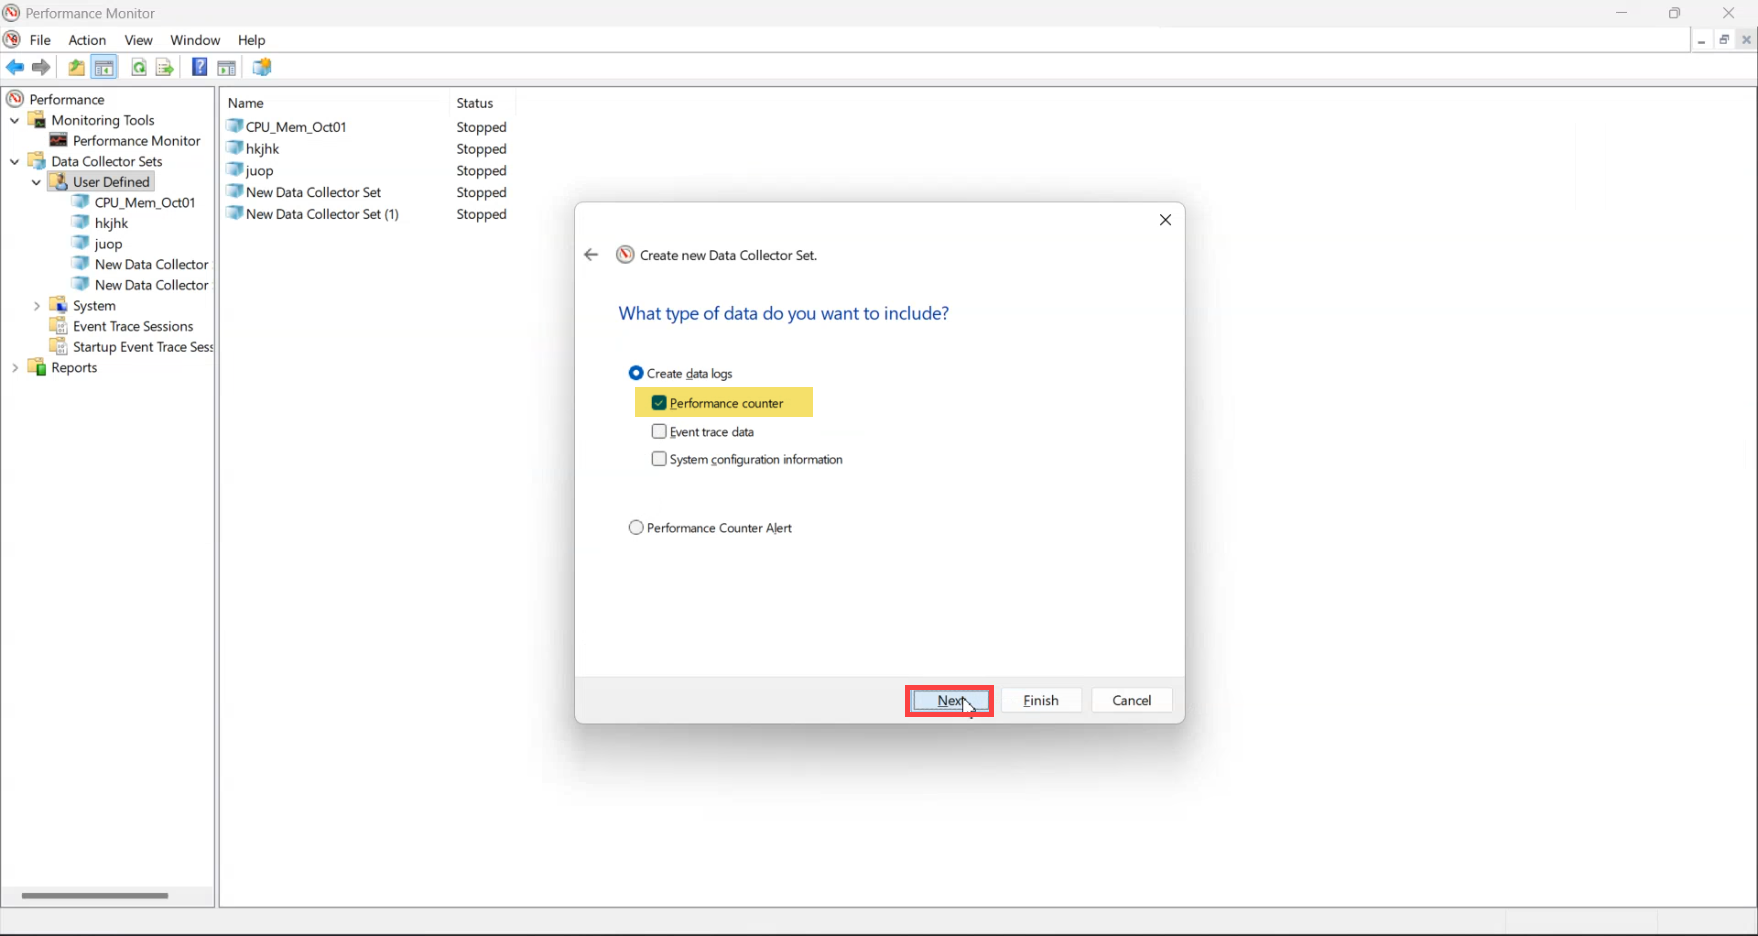
- Click Next. The Add Counters dialog appears.
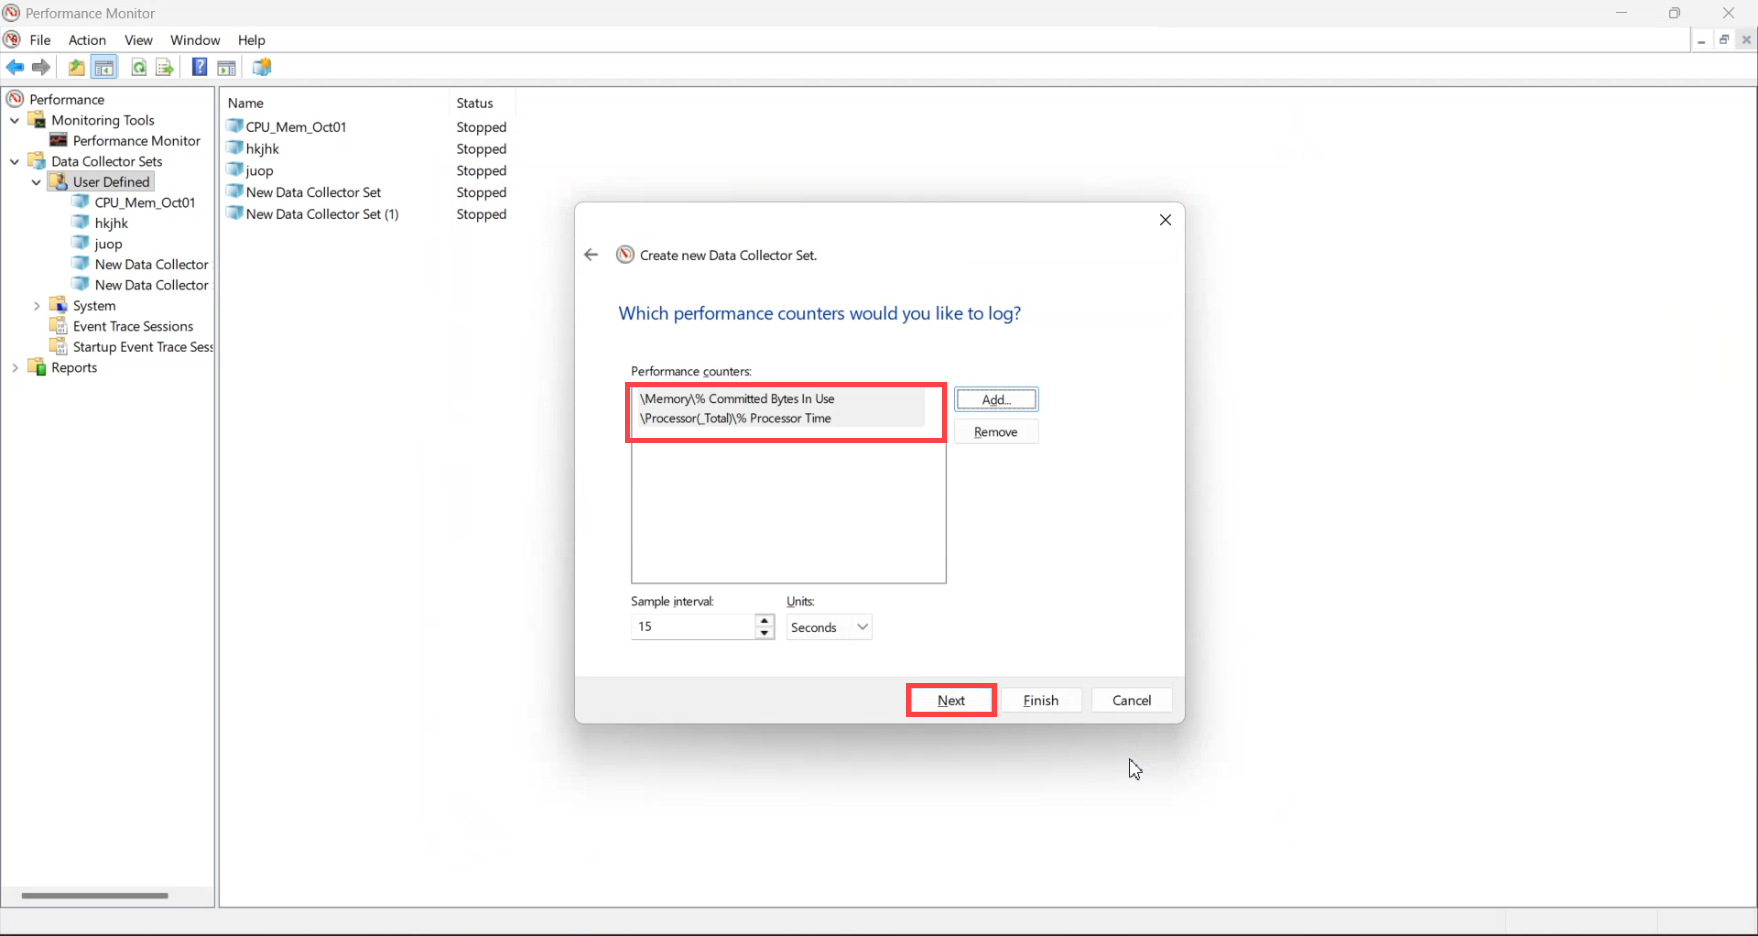
- For the headline CPU number, expand the Processor performance object → pick % Processor Time → pick the _Total instance. Click Add.
- For the headline memory number, expand Memory → pick % Committed Bytes In Use. Click Add.
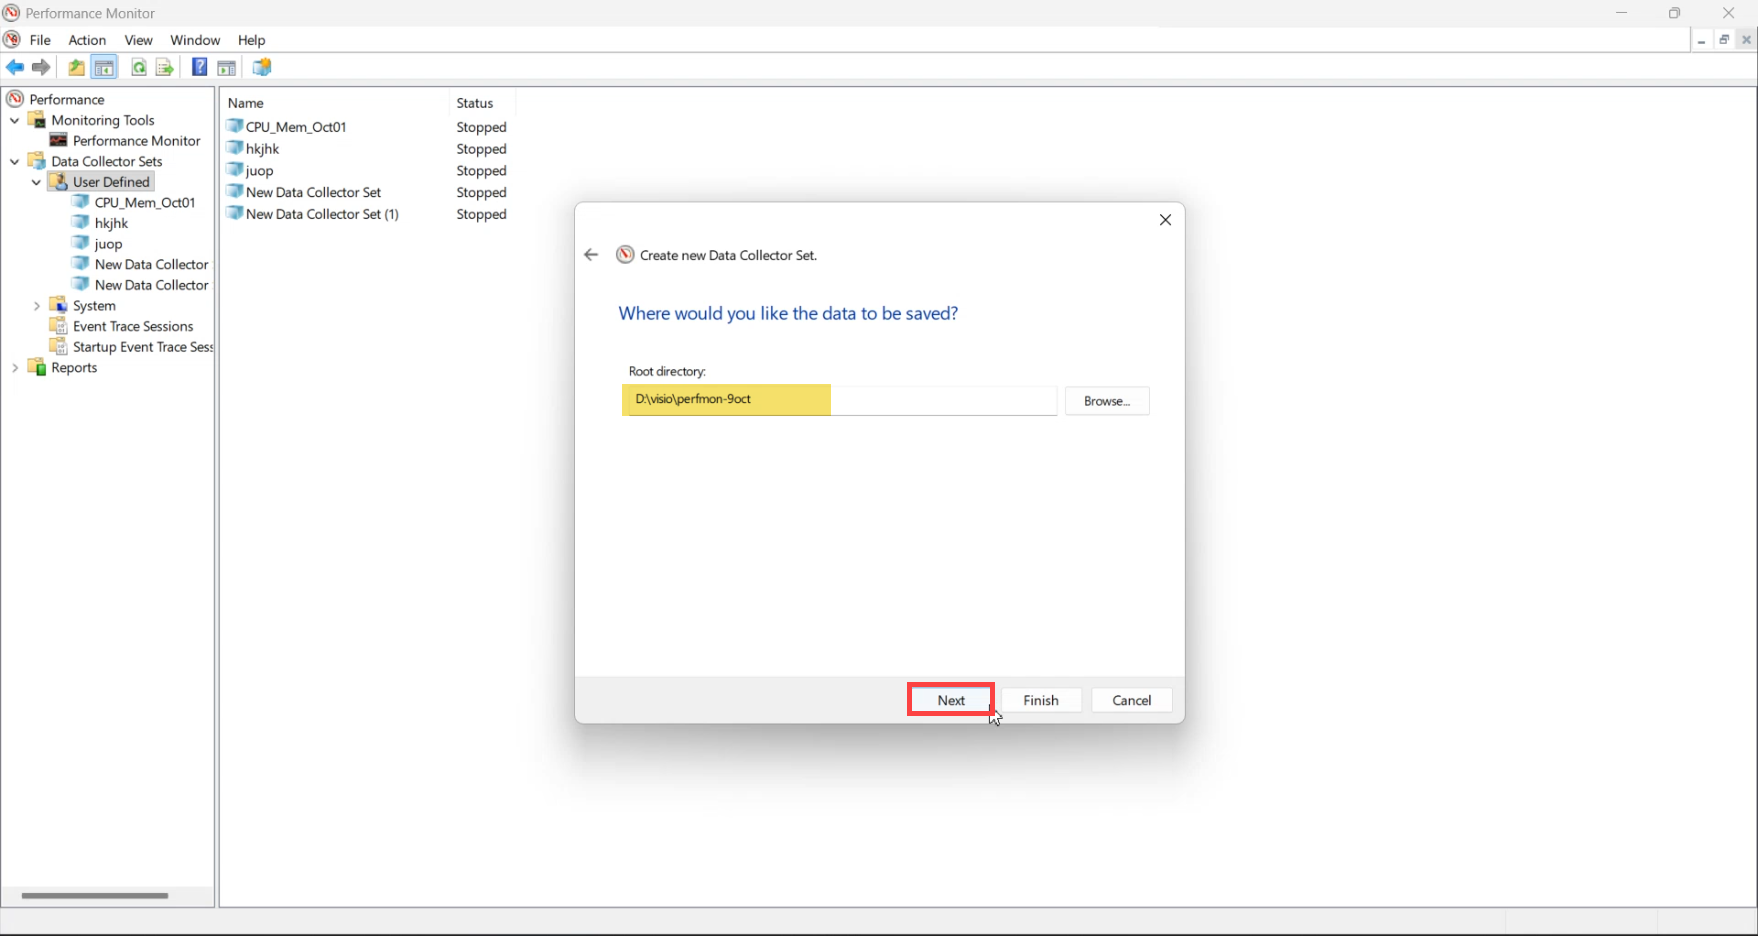
C:\PerfLogs\<set-name>\ is fine for most labs; pin to a different volume if you expect long-running captures with large BLG files.Step 5 — Save and close (don’t auto-start)
The wizard asks whether to start the set immediately. Pick Save and close — we want the schedule to be the trigger, not a wizard click. Click Finish.
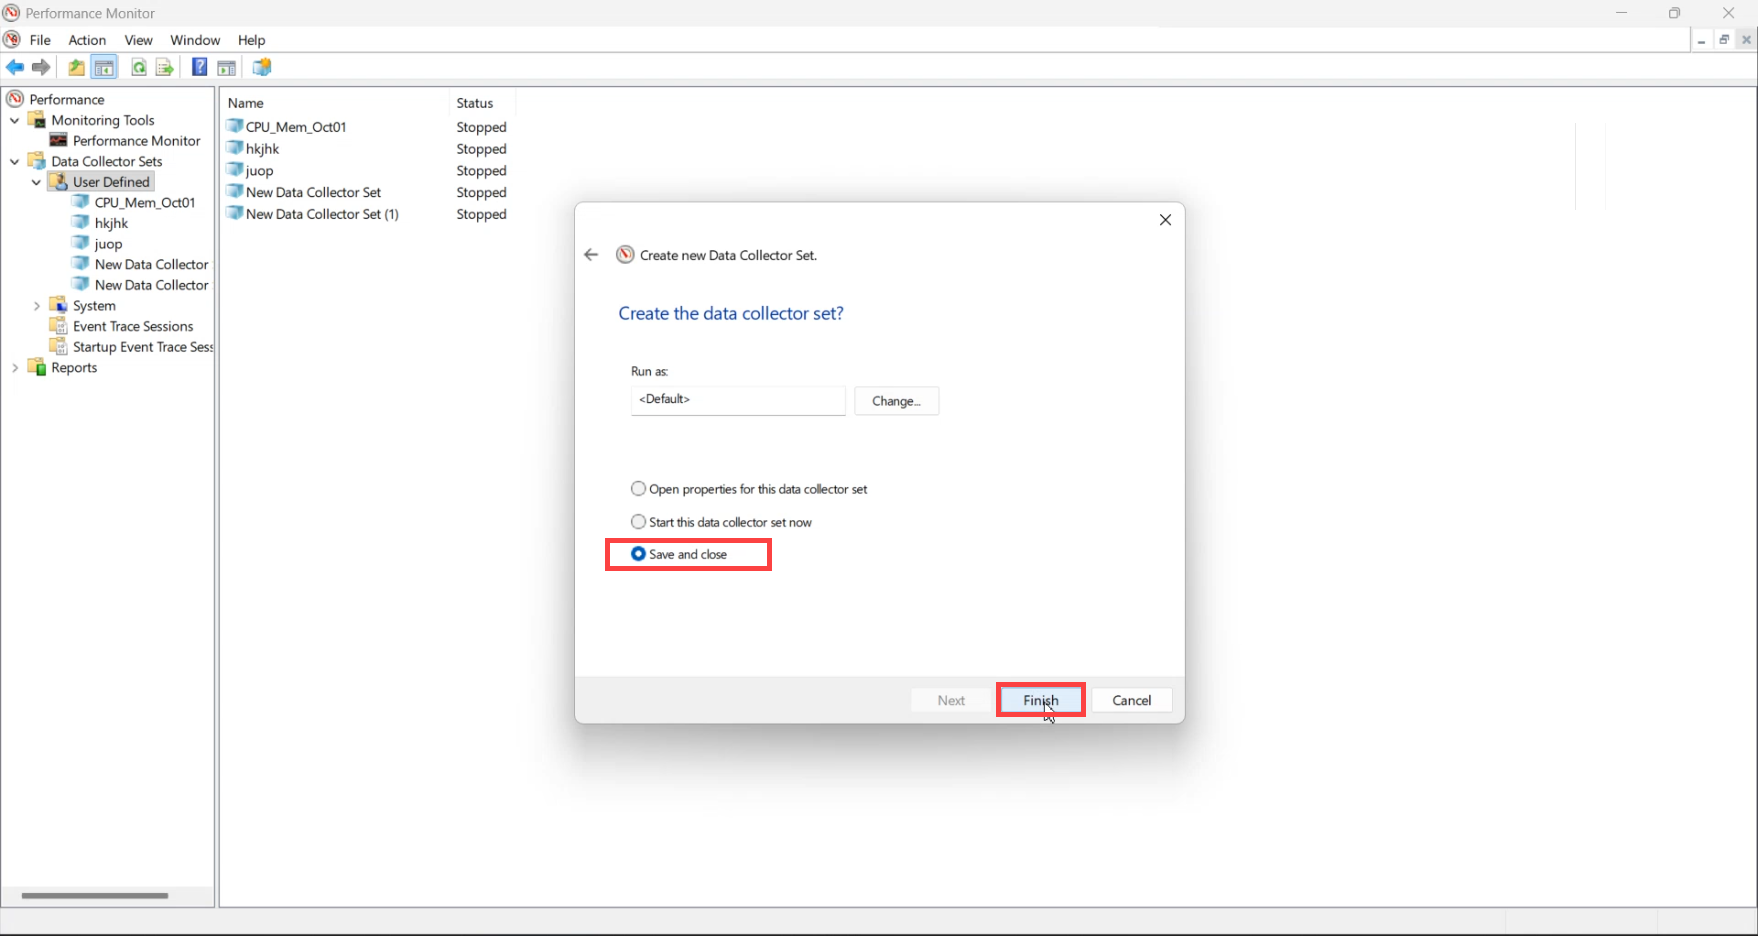
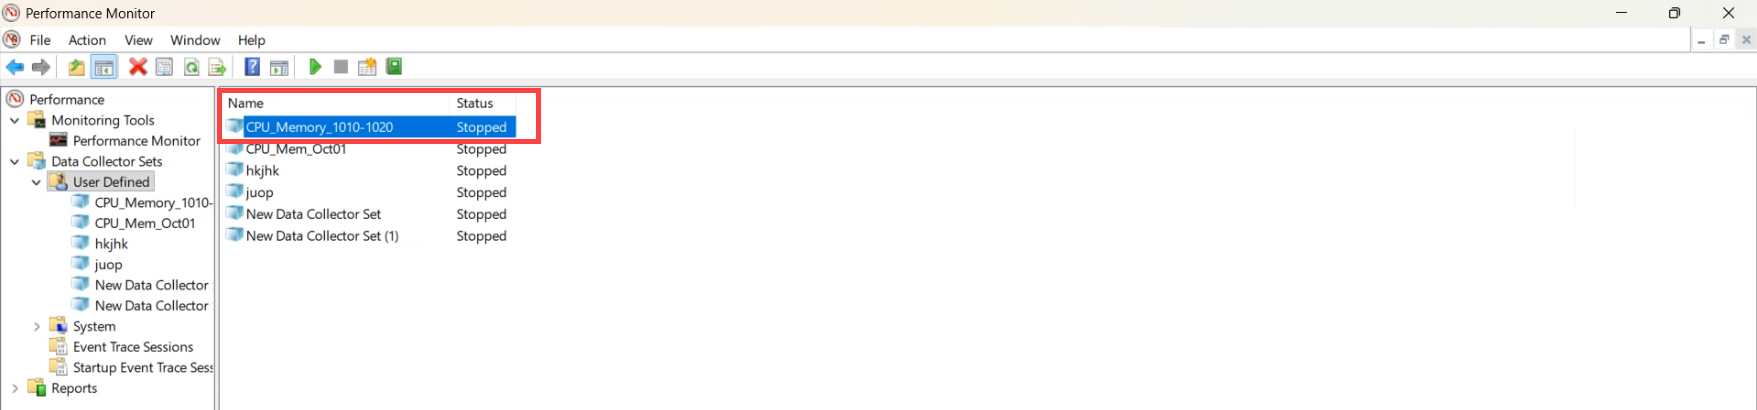
The DCS appears under User Defined in the left pane.
Step 6 — Add the schedule
- Right-click the new DCS → Properties.
- Switch to the Schedule tab.
- Click Add. In the schedule dialog:
- Beginning date: today (or whenever you want the first run).
- Start time: 10:30:00 PM (or whatever window you’re targeting).
- Days: tick the days the schedule should fire.
- Click OK.
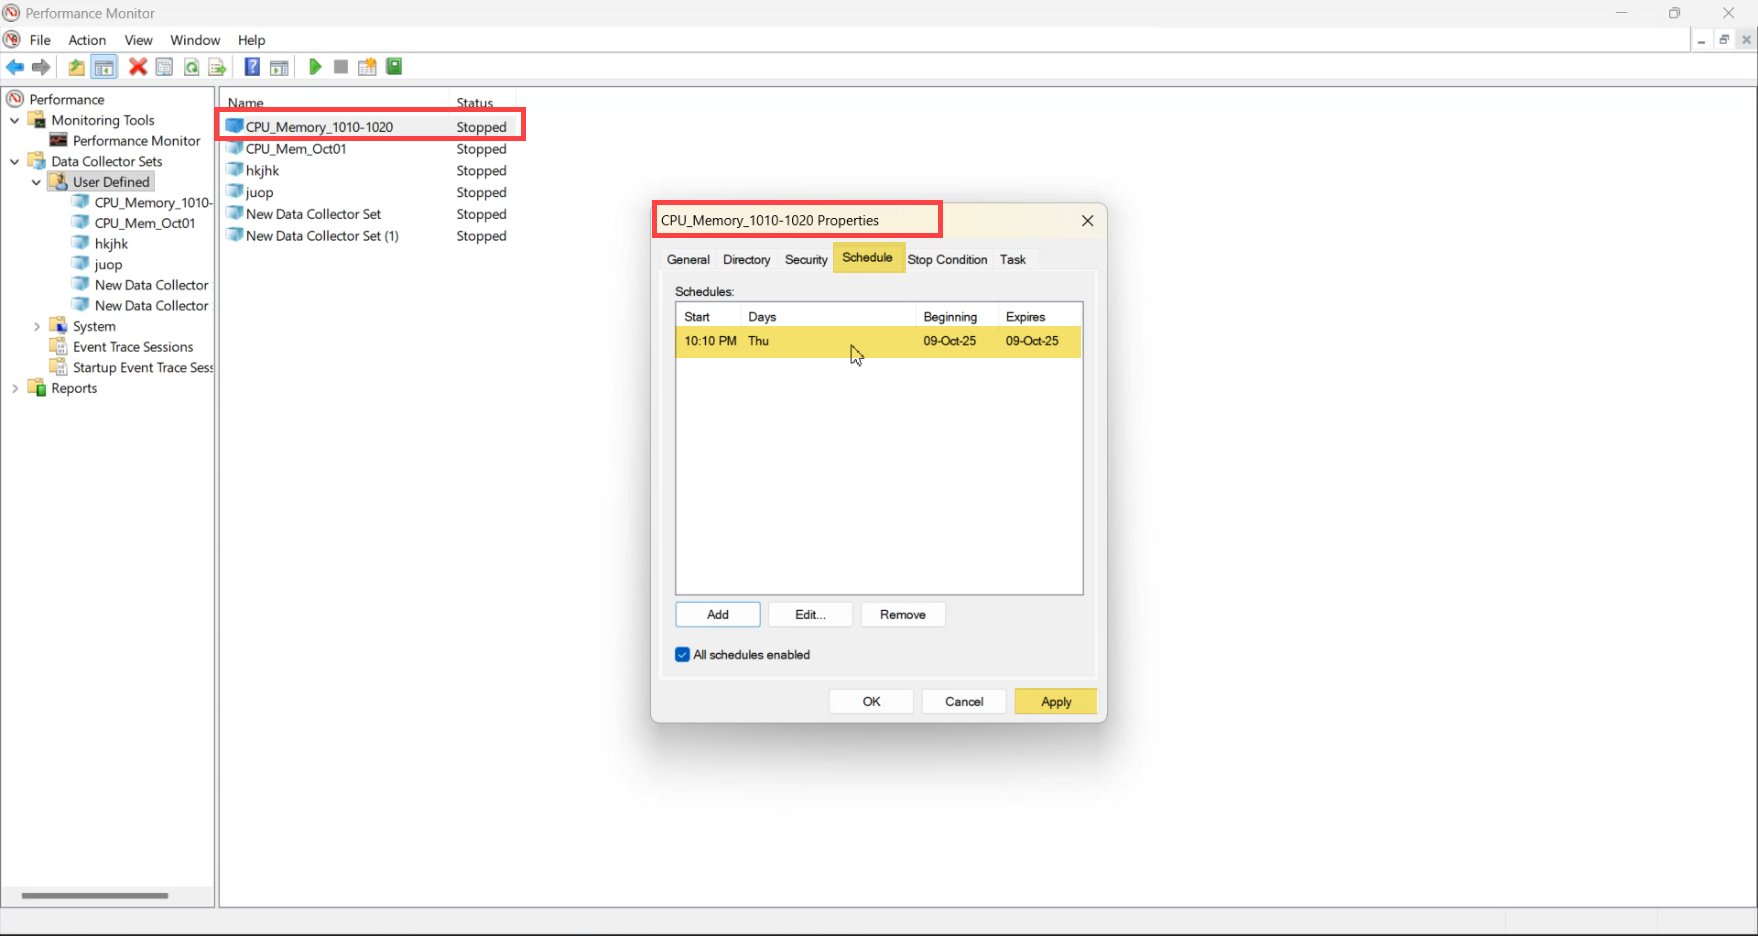
Behind the scenes, this writes a Task Scheduler entry under Task Scheduler Library → Microsoft → Windows → PLA (Performance Logs and Alerts). You can confirm it shows up there if you want belt-and-braces evidence the schedule landed.
Step 7 — Set the stop condition
- Switch to the Stop Condition tab in the same Properties dialog.
- Tick Overall duration → Stop after → set the value (the lab uses 30 minutes for a 22:30–23:00 capture).
- Click OK.
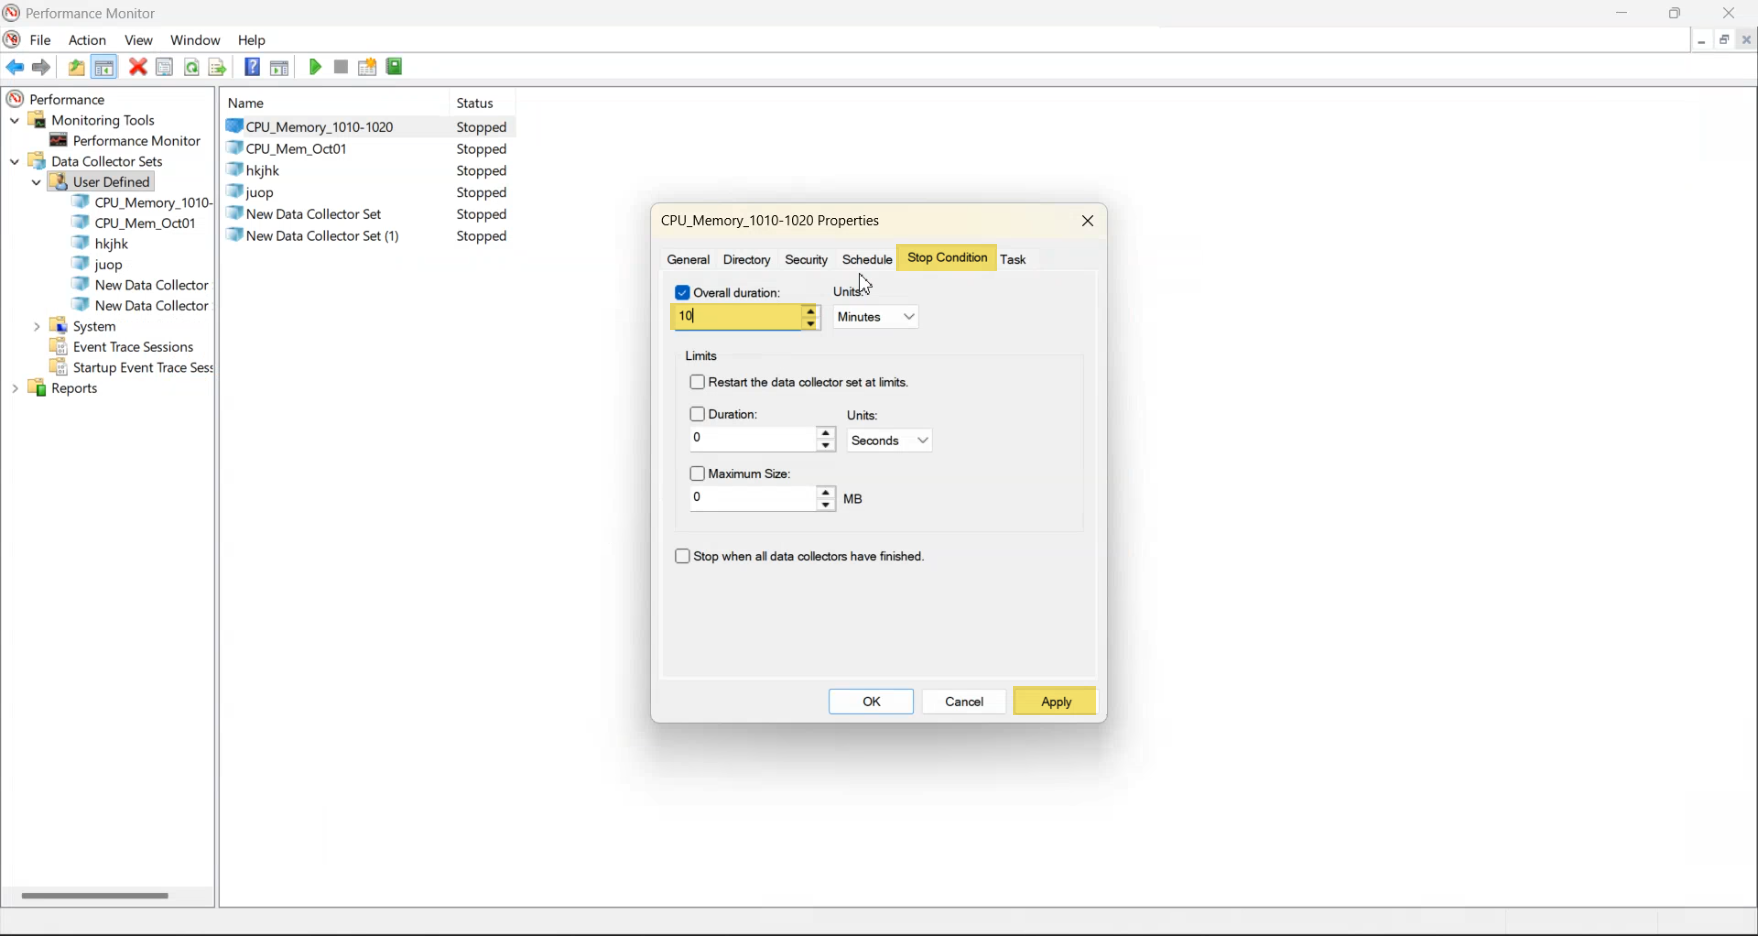
Without a stop condition, the capture runs until you manually stop it — on long-running setups that quietly fills disk. Always set a stop condition equal to the window you actually want to analyse.
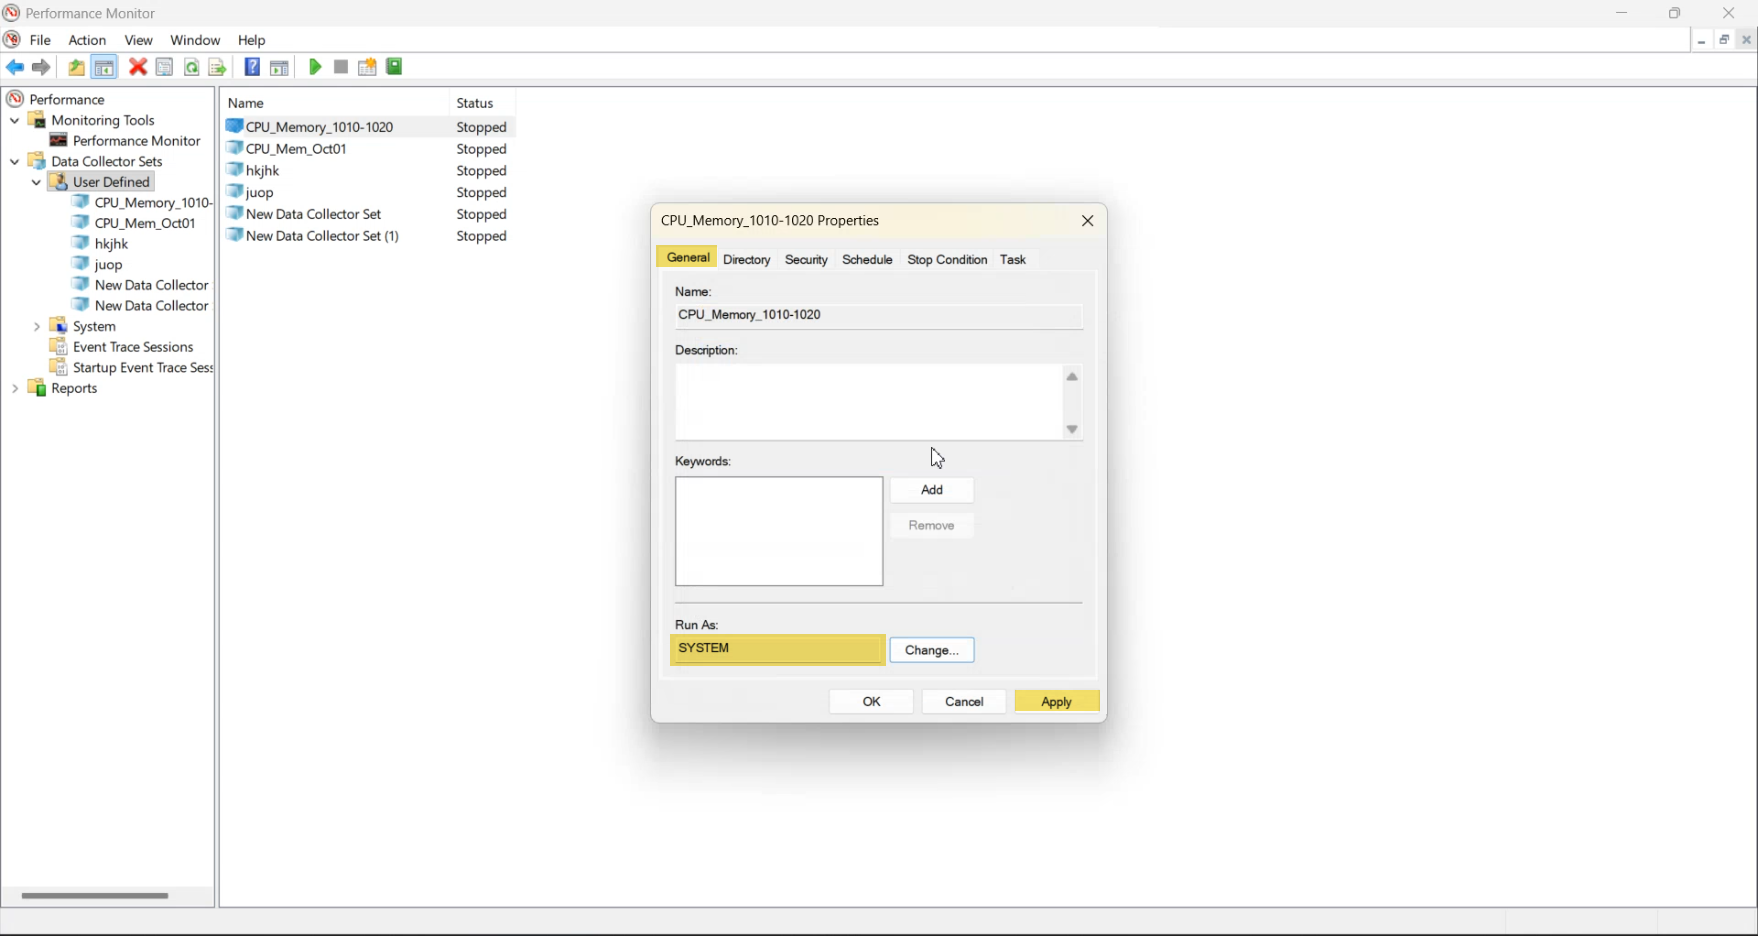
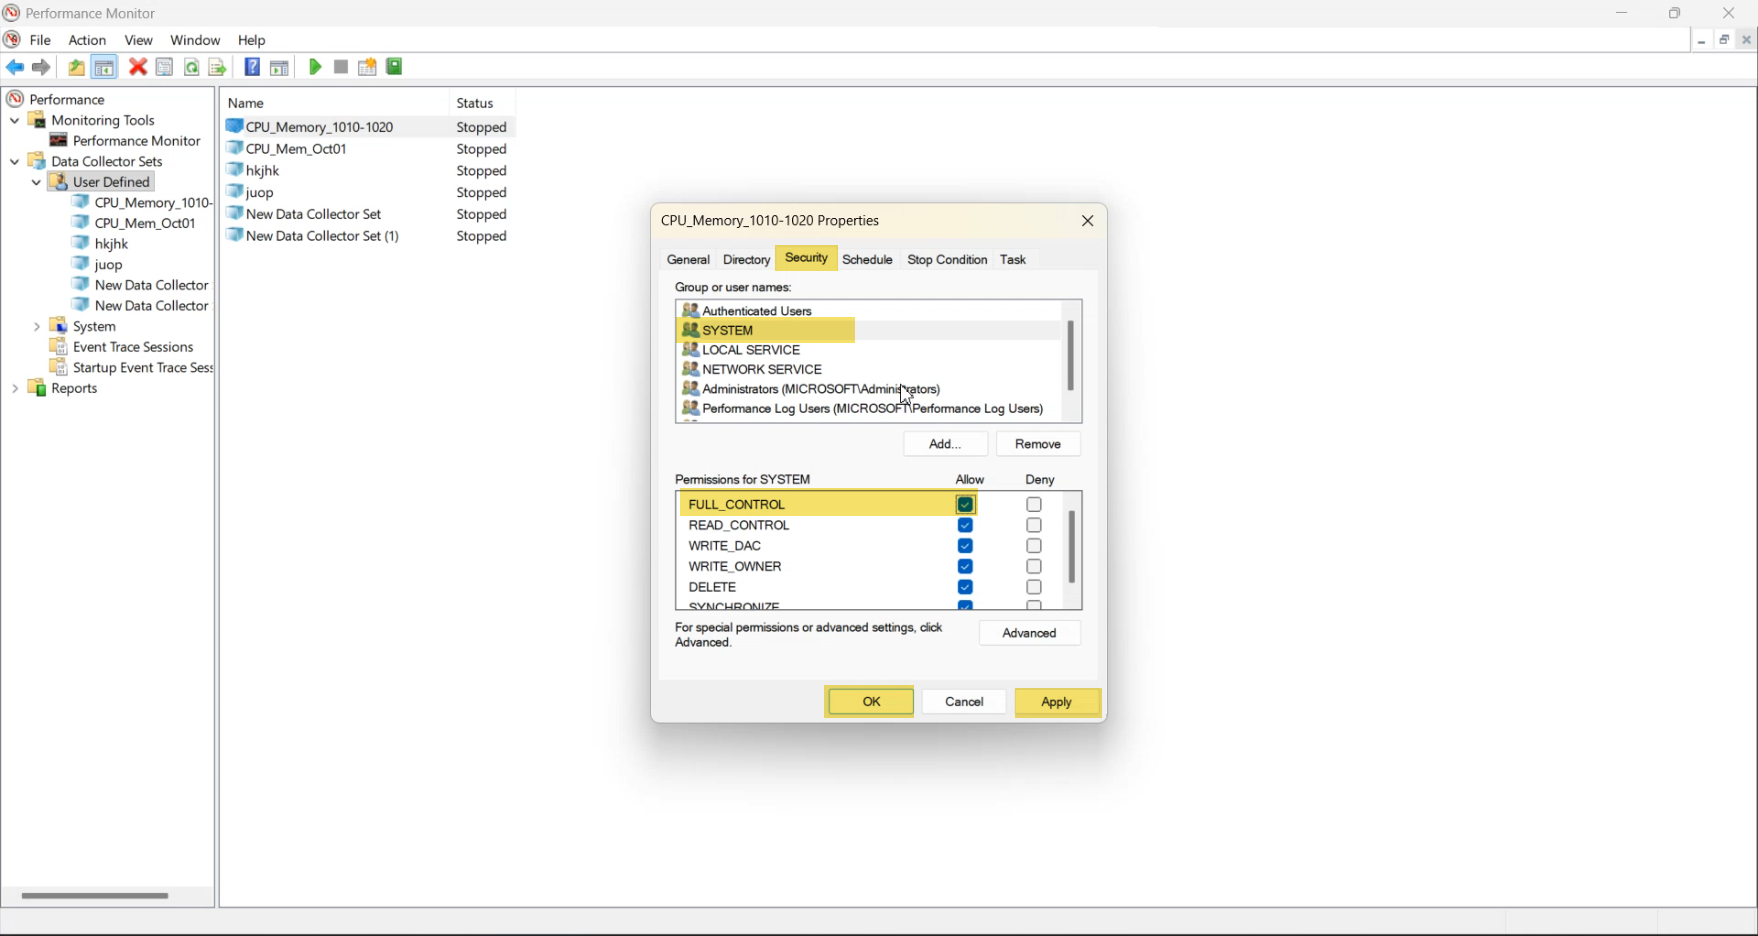
Step 8 — Run-as account and SYSTEM permissions
- Properties → Security tab.
- Set Run as to an admin or service account that has access to the counters and the destination folder. The default System works for local-machine-only counters; remote captures or non-default counter providers may need a specific identity.
- Tick Run whether user is logged on or not.
- Confirm SYSTEM has Full Control on the set so the scheduler can fire it unattended.
Same gotcha as scheduled tasks generally — the run-as account needs the “Log on as a batch job” user right on the local machine. Built-in admins have it; service accounts you bring in via GPO need it explicitly granted.
Step 9 — Wait for the capture, then read the BLG
Come back after the schedule window ends. Open the save folder:
C:\PerfLogs\CPU_Memory_Test\You should see a .blg file with an auto-incrementing suffix (so successive runs don’t overwrite each other). Filename pattern: <set-name>_<NNNNNN>.blg.
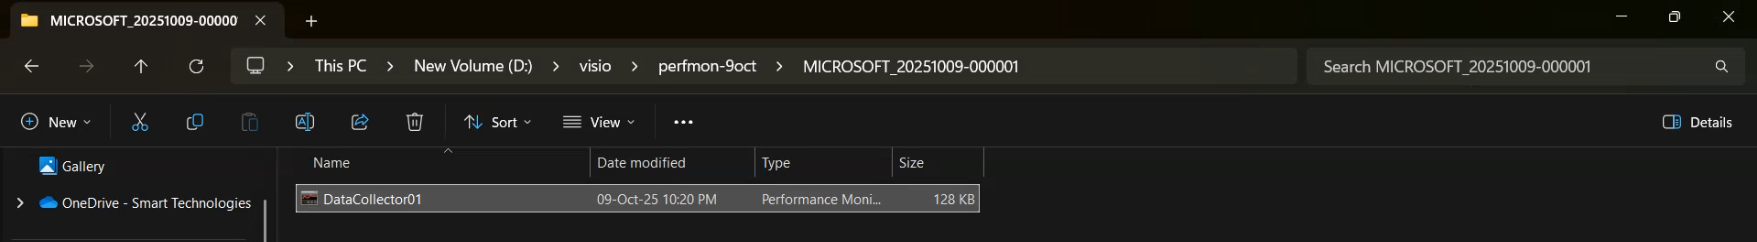
.blg binary log file in the configured folder. The filename embeds a counter that increments per capture so successive runs don’t overwrite.Open in PerfMon
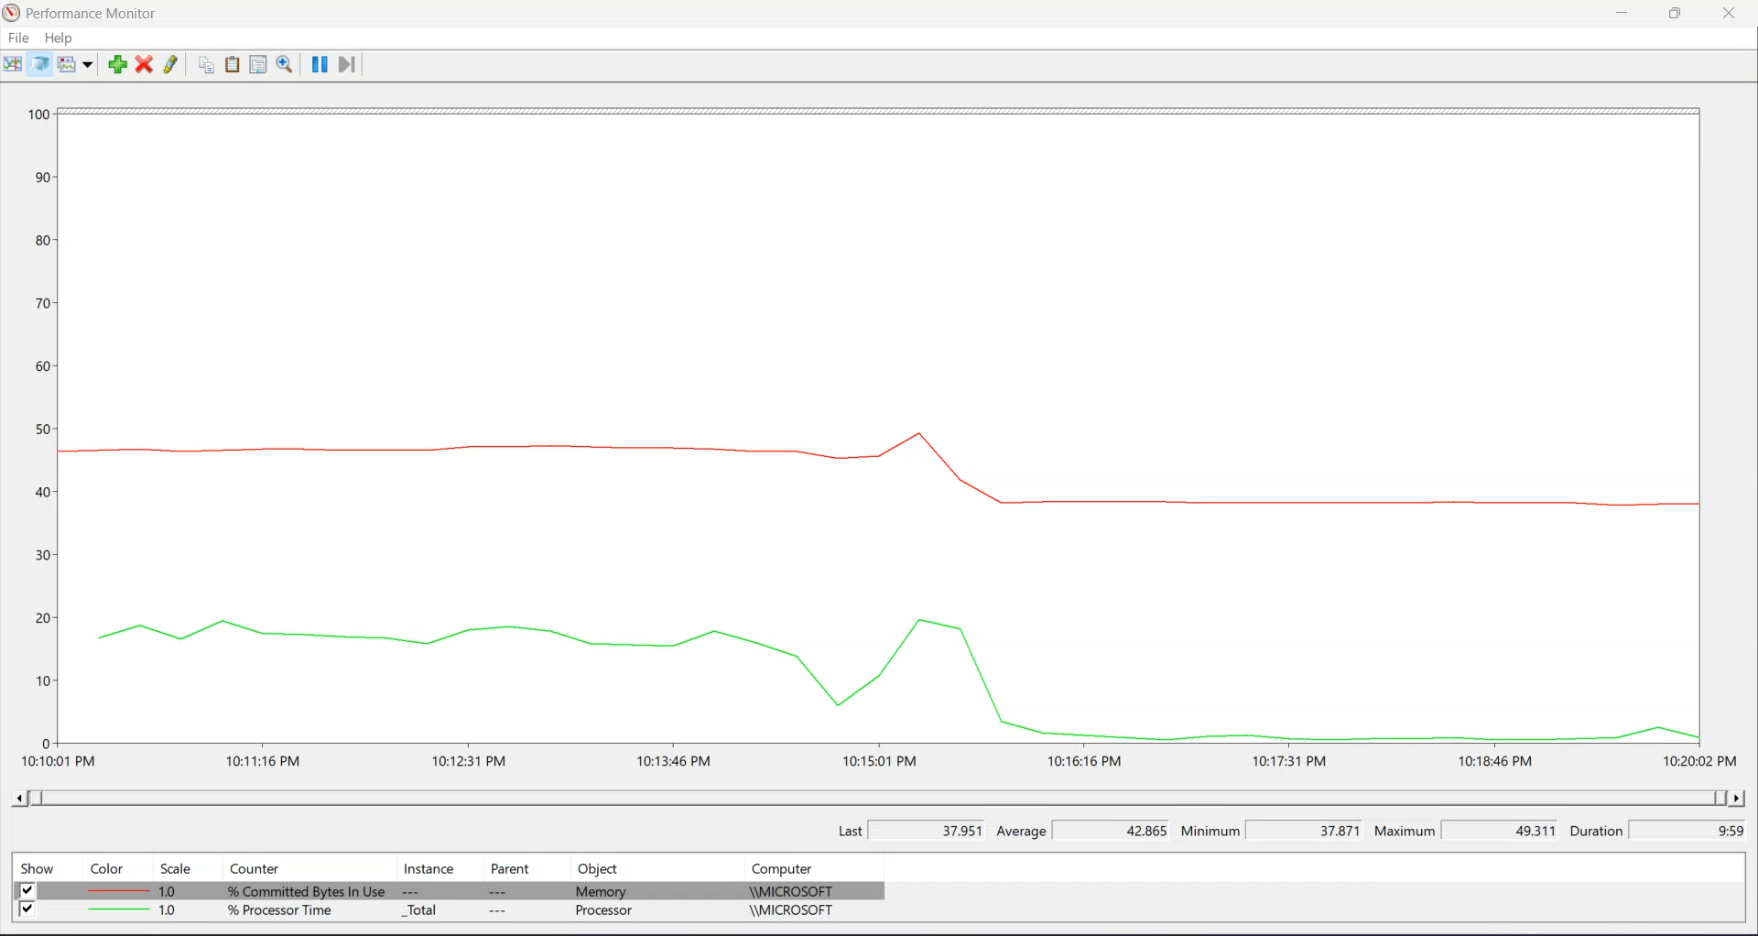
- In Performance Monitor, File → Open (or drag the BLG into the console).
- The captured data renders as a line graph by default.
- Switch to Report view via the toolbar icon for a tabular Min/Max/Avg layout per counter — usually easier to read than the graph.
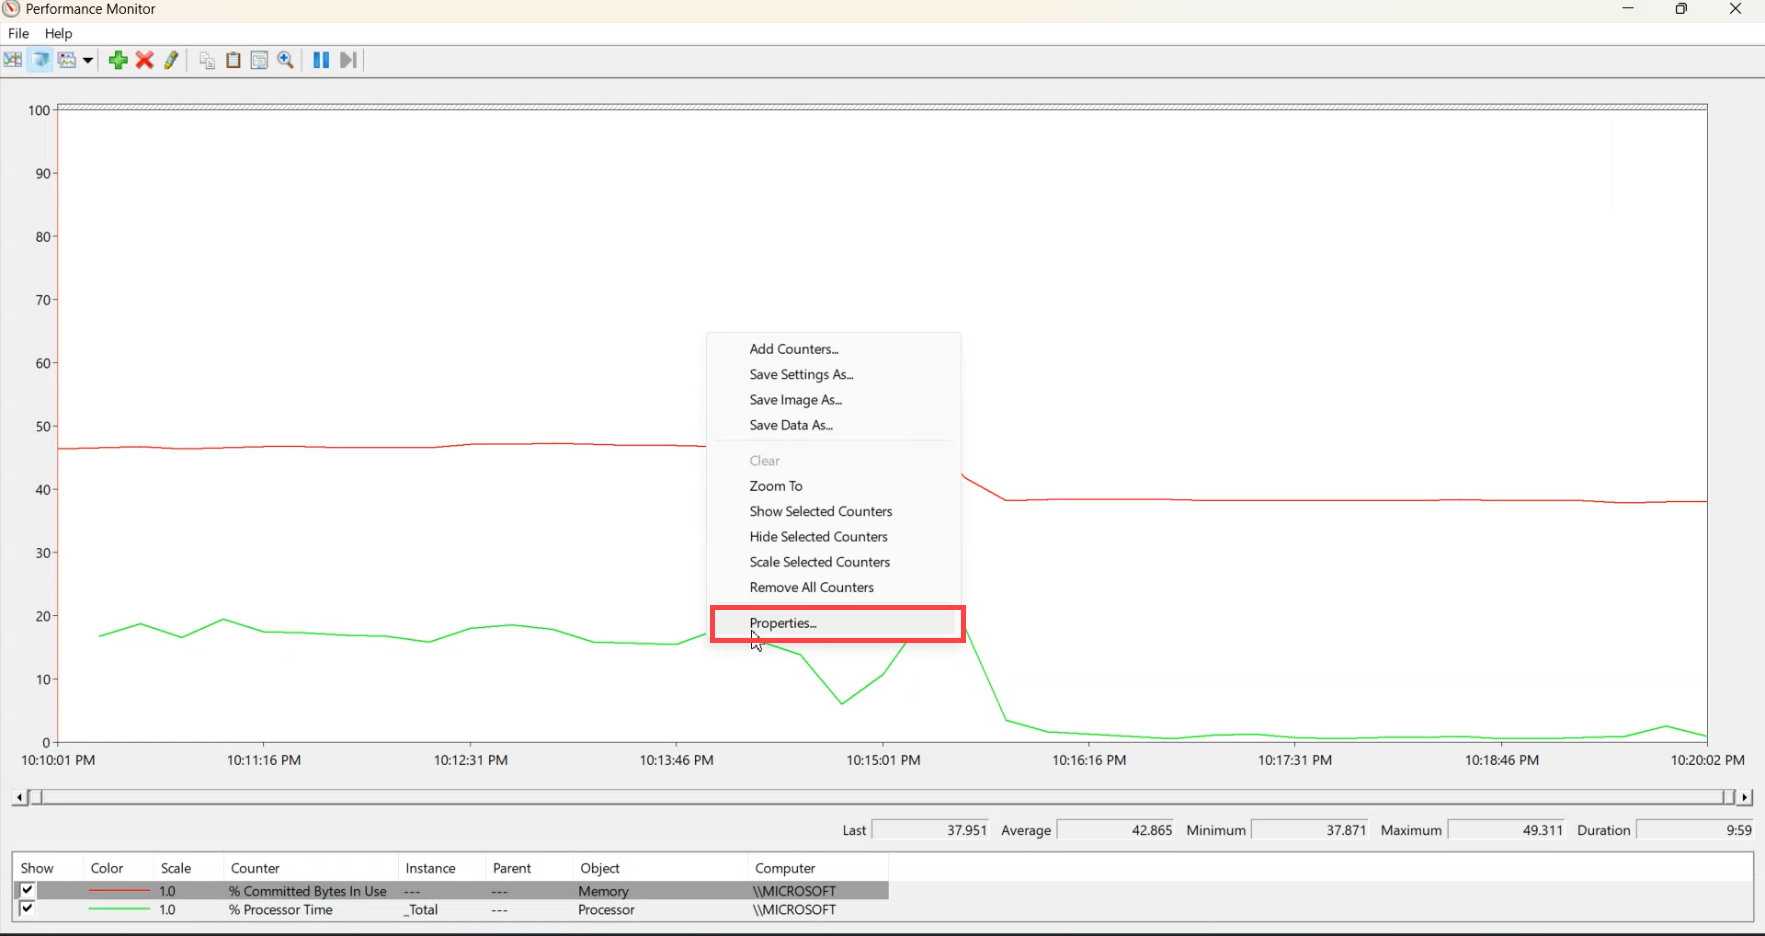
Quick stats via Properties → Data
- Right-click inside the graph → Properties.
- Switch to the Data tab.
- The columns Minimum / Maximum / Average are populated per counter for the loaded BLG window.
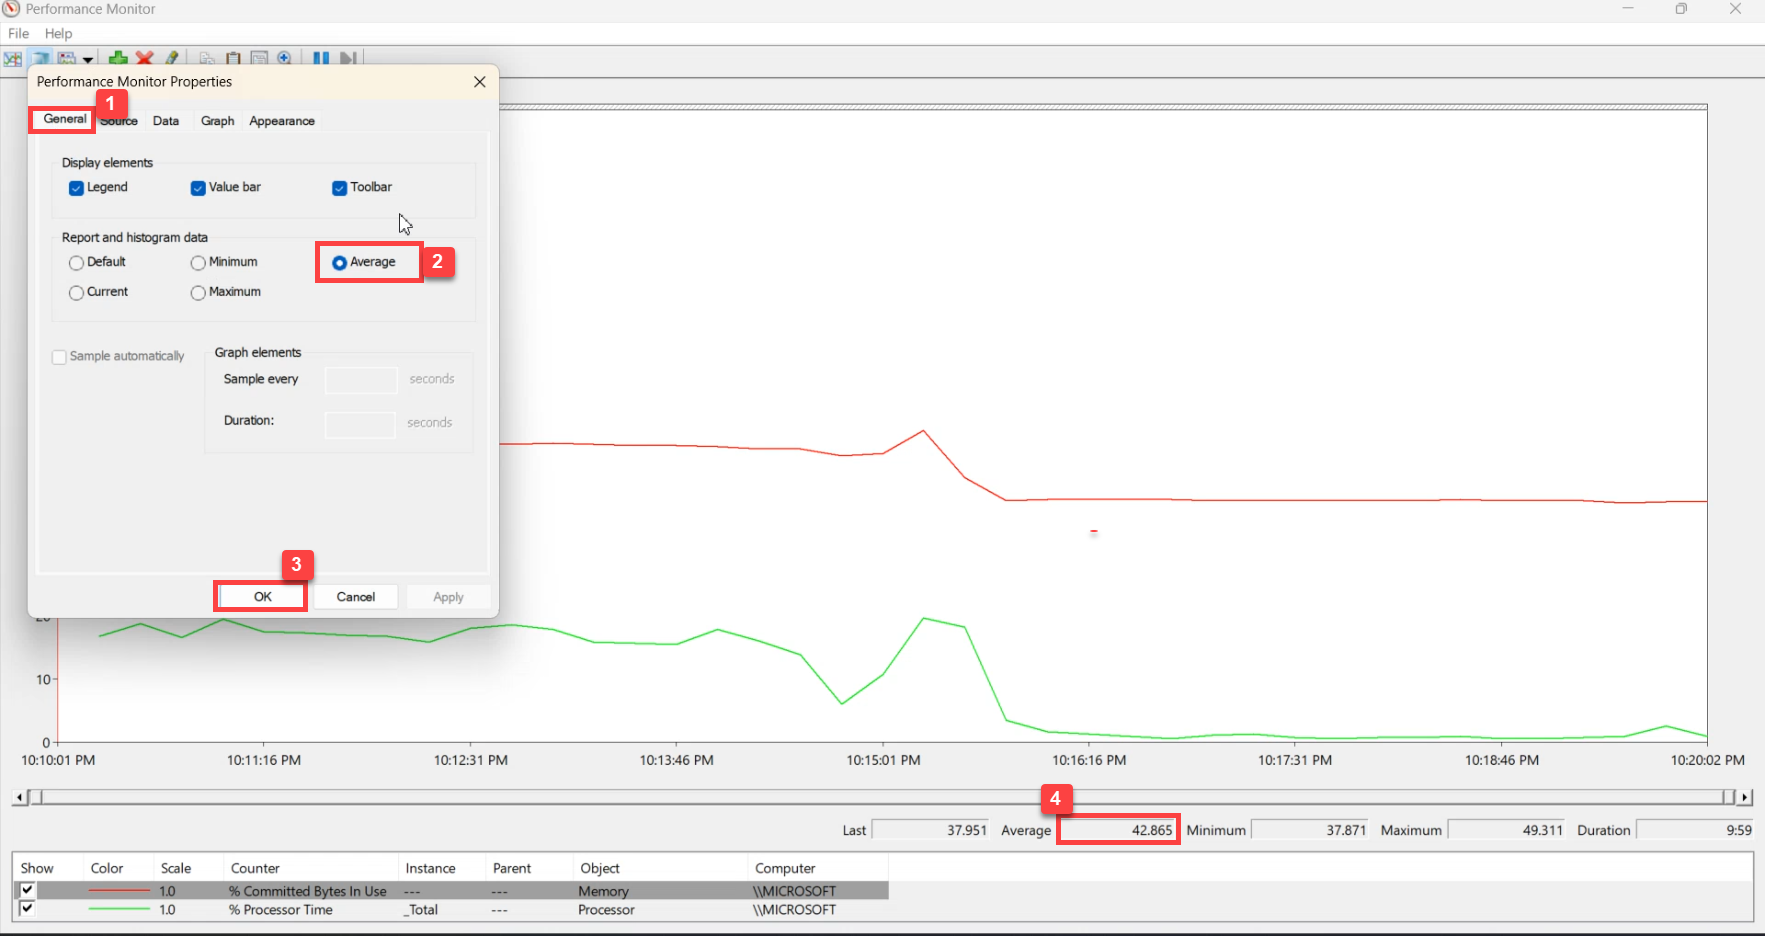
relog.This is the canonical way to read a BLG without opening Excel.
Optional: convert BLG to CSV for Excel analysis
For deeper analysis (per-sample averages, percentile calculations, custom windowing) the relog command-line tool exports a BLG to CSV:
relog "C:\PerfLogs\CPU_Memory_Test\CPU_Memory_1030_to_11PM_000001.blg" -f CSV -o C:\PerfLogs\output.csvOpen output.csv in Excel. Each counter is a column; each sample is a row. AVERAGE() / MAX() / PERCENTILE.INC() formulas all work on the columns. Useful for the questions Properties → Data can’t answer (e.g., “what was the 95th percentile CPU during the window?”).
Things that bite people in production
Forgetting the stop condition fills the disk
Without an Overall Duration stop, the capture runs until you manually stop it. On a busy server with high-cardinality counters (per-process, per-disk), the BLG grows by tens of MB per minute. A weekend of unattended capture can push hundreds of GB of BLG. Always set a Stop condition.
Sample interval below 1 second produces unstable timing
The PerfMon counter API isn’t designed for sub-second sampling — the OS scheduler can’t guarantee tight timing at that resolution, and you get jittered intervals that mess up percentile calculations. Stick to 1+ second intervals; for higher resolution, use ETW providers via xperf instead of PerfMon counter sets.
Run-as account permissions silently break captures
If the configured Run-as account doesn’t have Log on as a batch job right or doesn’t exist anymore (an old admin account that’s been deleted), the scheduled capture starts but produces no BLG — the Task Scheduler entry just fails silently. Verify periodically by checking the save folder for fresh BLGs after expected schedule windows.
BLG files don’t auto-rotate
Each scheduled run produces a new BLG with an incrementing suffix; the old ones stay forever. Without cleanup, the save folder grows without bound. Either set a manual rotation policy (a separate scheduled task that deletes BLGs older than N days) or use Windows’ built-in Storage Sense to clean up.
Counter paths are localised in non-English Windows
The counter Processor → % Processor Time is named in the system display language — on a Spanish Windows install it’s Procesador → % Tiempo de procesador. DCS export/import across languages can fail to find the counters. Microsoft documents the locale-neutral counter names; use those for portable DCS definitions.
The relog conversion to CSV is single-threaded and slow
For multi-GB BLG files, relog CSV conversion is single-threaded and CPU-bound — can take half an hour or more. For large captures, either filter to a sub-set of counters (relog -c "\Processor(_Total)\% Processor Time" ...) before conversion, or use the -q SQL output mode and query directly.
Where this fits
Scheduled PerfMon captures are part of broader Windows server diagnostics. For the Task Scheduler that backs the schedule, see Task Scheduler General tab and Trigger tab. For broader Windows Server admin context, the Windows Server administration pathway covers the rest of the surface area.